Backtesting Absorption
Does absorption signal reversals?
Let's quantify absorption - an increased level of volume at a particular price level relative to other price levels.
See also What is Absorption.
First let's create an indicator to make sure we are adequately targeting areas of absorption. If we look at 1m footprint candles we can see an average of 5 contracts traded per price level. High volume can be considered anything above 20 contracts per price level. (We can come to this conclusion either quantitatively or qualitatively.) We will highlight each buy or sell price with a yellow box.
const ABSORPTION_SIZE = 20
const NEARBY_TICKS = 5
const NEARBY_MULTIPLE = 3
const NEARBY_TIME_MS = 60_000

function median(values: number[]): number {
  if (values.length === 0) return 0
  const sorted = [...values].sort((a, b) => a - b)
  const mid = Math.floor(sorted.length / 2)
  return sorted.length % 2 === 0 ? (sorted[mid - 1] + sorted[mid]) / 2 : sorted[mid]
}

interface RowEntry { candleTime: number; price: number; buys: number; sells: number }

function buildAllEntries(): RowEntry[] {
  const entries: RowEntry[] = []
  for (const c of candles) {
    for (const level of c.levels) {
      entries.push({ candleTime: c.time, price: level.price, buys: level.buys, sells: level.sells })
    }
  }
  return entries
}

chart.frame((view, draw) => {
  const allEntries = buildAllEntries()
  const globalMedianTotalVolume = median(allEntries.map(r => r.buys + r.sells))
  const nearbyThreshold = globalMedianTotalVolume * NEARBY_MULTIPLE

  let sellBoxCount = 0
  let buyBoxCount = 0

  for (const c of view.candles) {
    const half = c.interval / 2
    const rowEntries = Object.entries(c.rows).map(([price, level]) => ({
      price: Number(price),
      buys: level.buys,
      sells: level.sells,
    }))
    const tickRange = NEARBY_TICKS * c.increment

    const nearbyEntries = (p: number) =>
      allEntries.filter(
        r => !(r.candleTime === c.time && r.price === p) &&
          Math.abs(r.candleTime - c.time) <= NEARBY_TIME_MS &&
          Math.abs(r.price - p) <= tickRange
      )

    const suppressSellAt = new Set<number>()
    const suppressBuyAt = new Set<number>()

    for (const { price: p, sells } of rowEntries) {
      if (sells <= ABSORPTION_SIZE) continue
      for (const r of nearbyEntries(p)) {
        if (r.buys > nearbyThreshold) {
          suppressSellAt.add(p)
          if (r.candleTime === c.time) suppressBuyAt.add(r.price)
        }
      }
    }
    for (const { price: p, buys } of rowEntries) {
      if (buys <= ABSORPTION_SIZE) continue
      for (const r of nearbyEntries(p)) {
        if (r.sells > nearbyThreshold) {
          suppressBuyAt.add(p)
          if (r.candleTime === c.time) suppressSellAt.add(r.price)
        }
      }
    }

    for (const { price: p, buys, sells } of rowEntries) {
      const top = p + c.increment / 2
      const bottom = p - c.increment / 2

      if (sells > ABSORPTION_SIZE && !suppressSellAt.has(p)) {
        sellBoxCount++
        draw.rectangle({
          price1: bottom, price2: top,
          time1: c.time, time2: c.time + half,
          color: 'transparent', borderColor: '#ffe600', borderWidth: 2,
        })
      }
      if (buys > ABSORPTION_SIZE && !suppressBuyAt.has(p)) {
        buyBoxCount++
        draw.rectangle({
          price1: bottom, price2: top,
          time1: c.time + half, time2: c.time + c.interval,
          color: 'transparent', borderColor: '#ffe600', borderWidth: 2,
        })
      }
    }
  }

  const last = view.candles[view.candles.length - 1]
  if (last) {
    draw.text({
      time: view.endTime,
      price: view.maxPrice,
      text: `Absorption boxes (visible): ${sellBoxCount + buyBoxCount} (sell ${sellBoxCount} / buy ${buyBoxCount})`,
      color: '#ffe600',
      size: 12,
      align: 'right',
    })
  }
})
If you look at the code, notice we additionally have a filter. We want to remove areas of high volume on both sides: if we have lots of buying and lots of selling, we wouldn't call this absorption. Let's see how it looks plotted across a whole day with 1m bars.
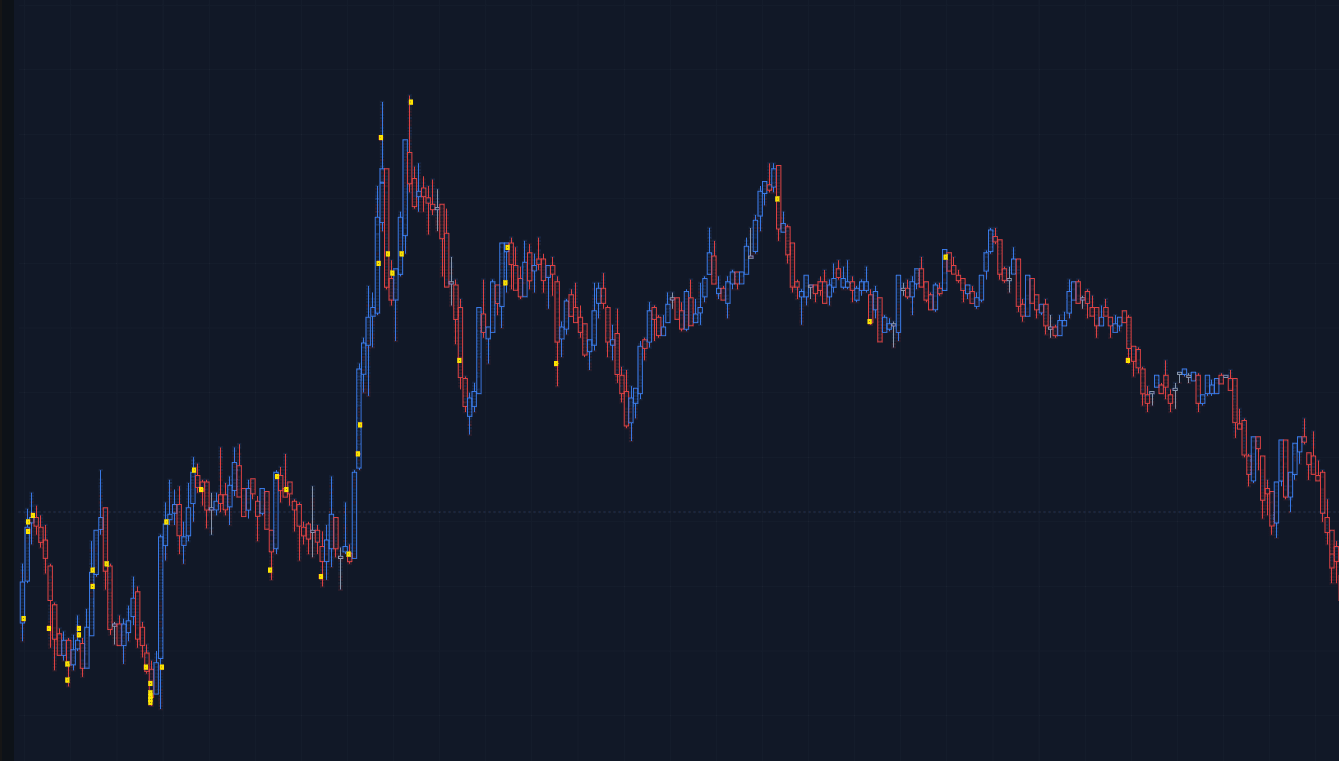
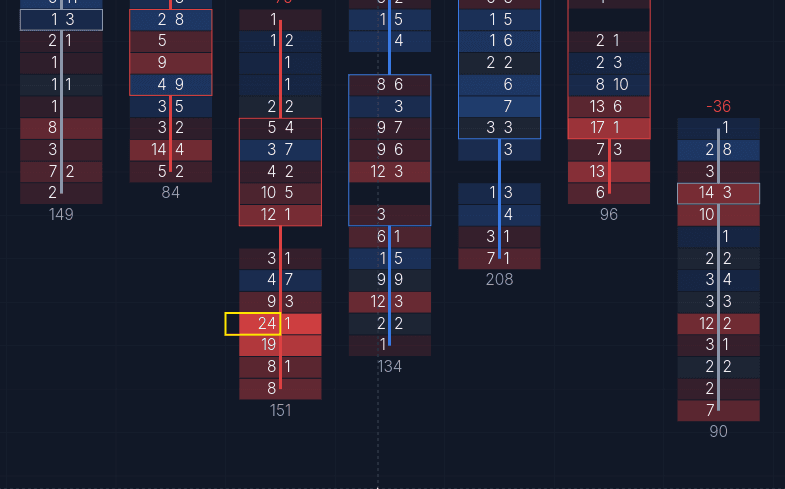
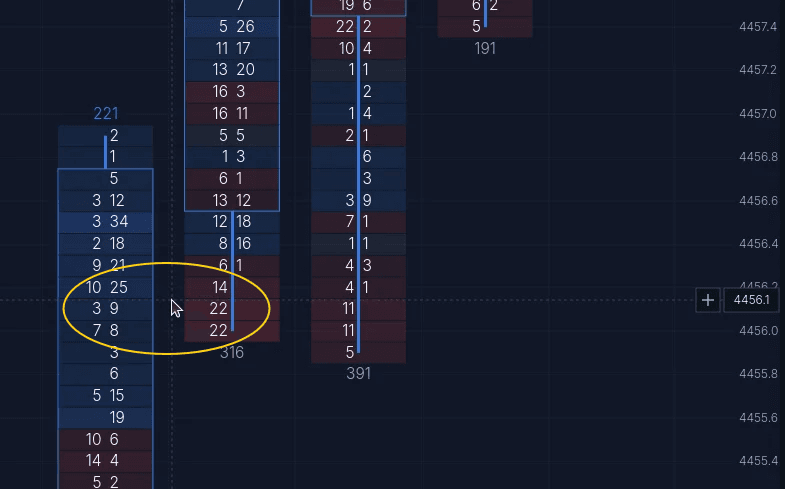
While not that technical of an indicator, I'm happy with what is and isn't highlighted. Let's now look at the resulting price movement in ticks (+1 = 1 tick up, -1 = 1 tick down) in several time windows.
Buy-side events (22)
| time | price | volume | 10s | 30s | 1m | 5m |
|---|---|---|---|---|---|---|
| 13:30 | 4449 | 21 | +20 | +27 | +28 | +19 |
| 13:31 | 4451.70 | 26 | +3 | +4 | +4 | -21 |
| 13:31 | 4452 | 30 | 0 | +1 | +1 | -24 |
| 13:32 | 4452.20 | 23 | +1 | -2 | -3 | -38 |
| 13:42 | 4448.50 | 39 | -8 | -10 | -10 | +36 |
| 13:42 | 4448.70 | 22 | -10 | -12 | -12 | +34 |
| 13:45 | 4450 | 47 | +13 | +9 | +17 | -12 |
| 13:45 | 4450.50 | 22 | +8 | +4 | +12 | -17 |
| 13:48 | 4450.70 | 23 | -6 | -14 | -20 | -18 |
| 14:00 | 4447.50 | 29 | +42 | +38 | +44 | +40 |
| 14:01 | 4452 | 22 | 0 | +12 | +2 | +4 |
| 14:07 | 4453.60 | 33 | 0 | -5 | -5 | -10 |
| 14:25 | 4453.40 | 21 | -3 | -6 | -4 | -15 |
| 14:27 | 4453 | 25 | 0 | -2 | -1 | -15 |
| 14:43 | 4455 | 27 | +22 | +13 | +25 | +79 |
| 14:47 | 4460 | 41 | +15 | +20 | +29 | +14 |
| 14:49 | 4460.30 | 23 | -6 | -7 | -14 | +22 |
| 14:50 | 4459.70 | 23 | -12 | -13 | +1 | +21 |
| 14:52 | 4460.30 | 25 | +3 | +17 | +35 | +18 |
| 14:54 | 4465 | 29 | -22 | -21 | -32 | -33 |
| 15:15 | 4460.50 | 22 | 0 | -3 | -5 | -10 |
| 16:50 | 4460.20 | 25 | -2 | -1 | -4 | -9 |
| average | 27.2 | +2.6 | +2.2 | +4.0 | +3.0 | |
Sell-side events (21)
| time | price | volume | 10s | 30s | 1m | 5m |
|---|---|---|---|---|---|---|
| 13:36 | 4448.70 | 27 | +3 | -3 | -3 | -7 |
| 13:40 | 4447.10 | 24 | +5 | +13 | +9 | +33 |
| 13:40 | 4447.60 | 34 | 0 | +8 | +4 | +28 |
| 13:57 | 4447.50 | 24 | 0 | -11 | -9 | +47 |
| 13:58 | 4446.40 | 26 | +4 | +10 | +12 | +61 |
| 13:58 | 4446.50 | 26 | +3 | +9 | +11 | +60 |
| 13:58 | 4446.60 | 27 | +2 | +8 | +10 | +59 |
| 13:58 | 4446.70 | 30 | +1 | +7 | +9 | +58 |
| 13:58 | 4447 | 35 | -2 | +4 | +6 | +55 |
| 14:09 | 4453 | 23 | -1 | -4 | -6 | -6 |
| 14:24 | 4450.50 | 23 | +20 | +29 | +30 | +19 |
| 14:35 | 4450.30 | 24 | 0 | +7 | +11 | +9 |
| 14:41 | 4451 | 22 | +1 | +5 | +25 | +76 |
| 14:43 | 4454.10 | 22 | +31 | +22 | +34 | +88 |
| 14:48 | 4463.90 | 21 | -22 | -44 | -46 | -1 |
| 15:05 | 4457 | 22 | -11 | -11 | -14 | +9 |
| 15:15 | 4459.40 | 23 | +11 | +8 | +6 | +1 |
| 15:26 | 4456.90 | 24 | +9 | +4 | +11 | +10 |
| 16:14 | 4462 | 21 | -4 | -8 | -8 | -29 |
| 16:34 | 4458.20 | 24 | +5 | +4 | +9 | -1 |
| 17:30 | 4457 | 21 | -1 | 0 | 0 | -10 |
| average | 24.9 | +2.6 | +2.7 | +4.8 | +26.6 | |
We expected to see an average of positive ticks after sell absorption but not positive ticks after buy absorption, so these are unconvincing results.
An issue with our averaging is that many of these absorption events occur within the same time period. What if we remove those overlaps from the results?
| side | events | volume | 10s | 30s | 1m | 5m |
|---|---|---|---|---|---|---|
| buy | 18 | 28.1 | +3.1 | +3.1 | +4.8 | +5.9 |
| sell | 16 | 24.8 | +2.5 | +1.8 | +4.3 | +18.7 |
The results for our buy absorption are even worse. At the surface level, I think we can safely assume trading directly with absorption is a bad strategy. However I wouldn't count this market behavior out, it would be prudent to look at these events individually and devise a stricter indicator.