Backtest Orderflow
Practice trading and review past sessions with historical orderflow replay, right in your browser. No need to record market data yourself.
Includes 5 minutes of replay time free daily, shared across up to 3 replays. Upgrade for more.
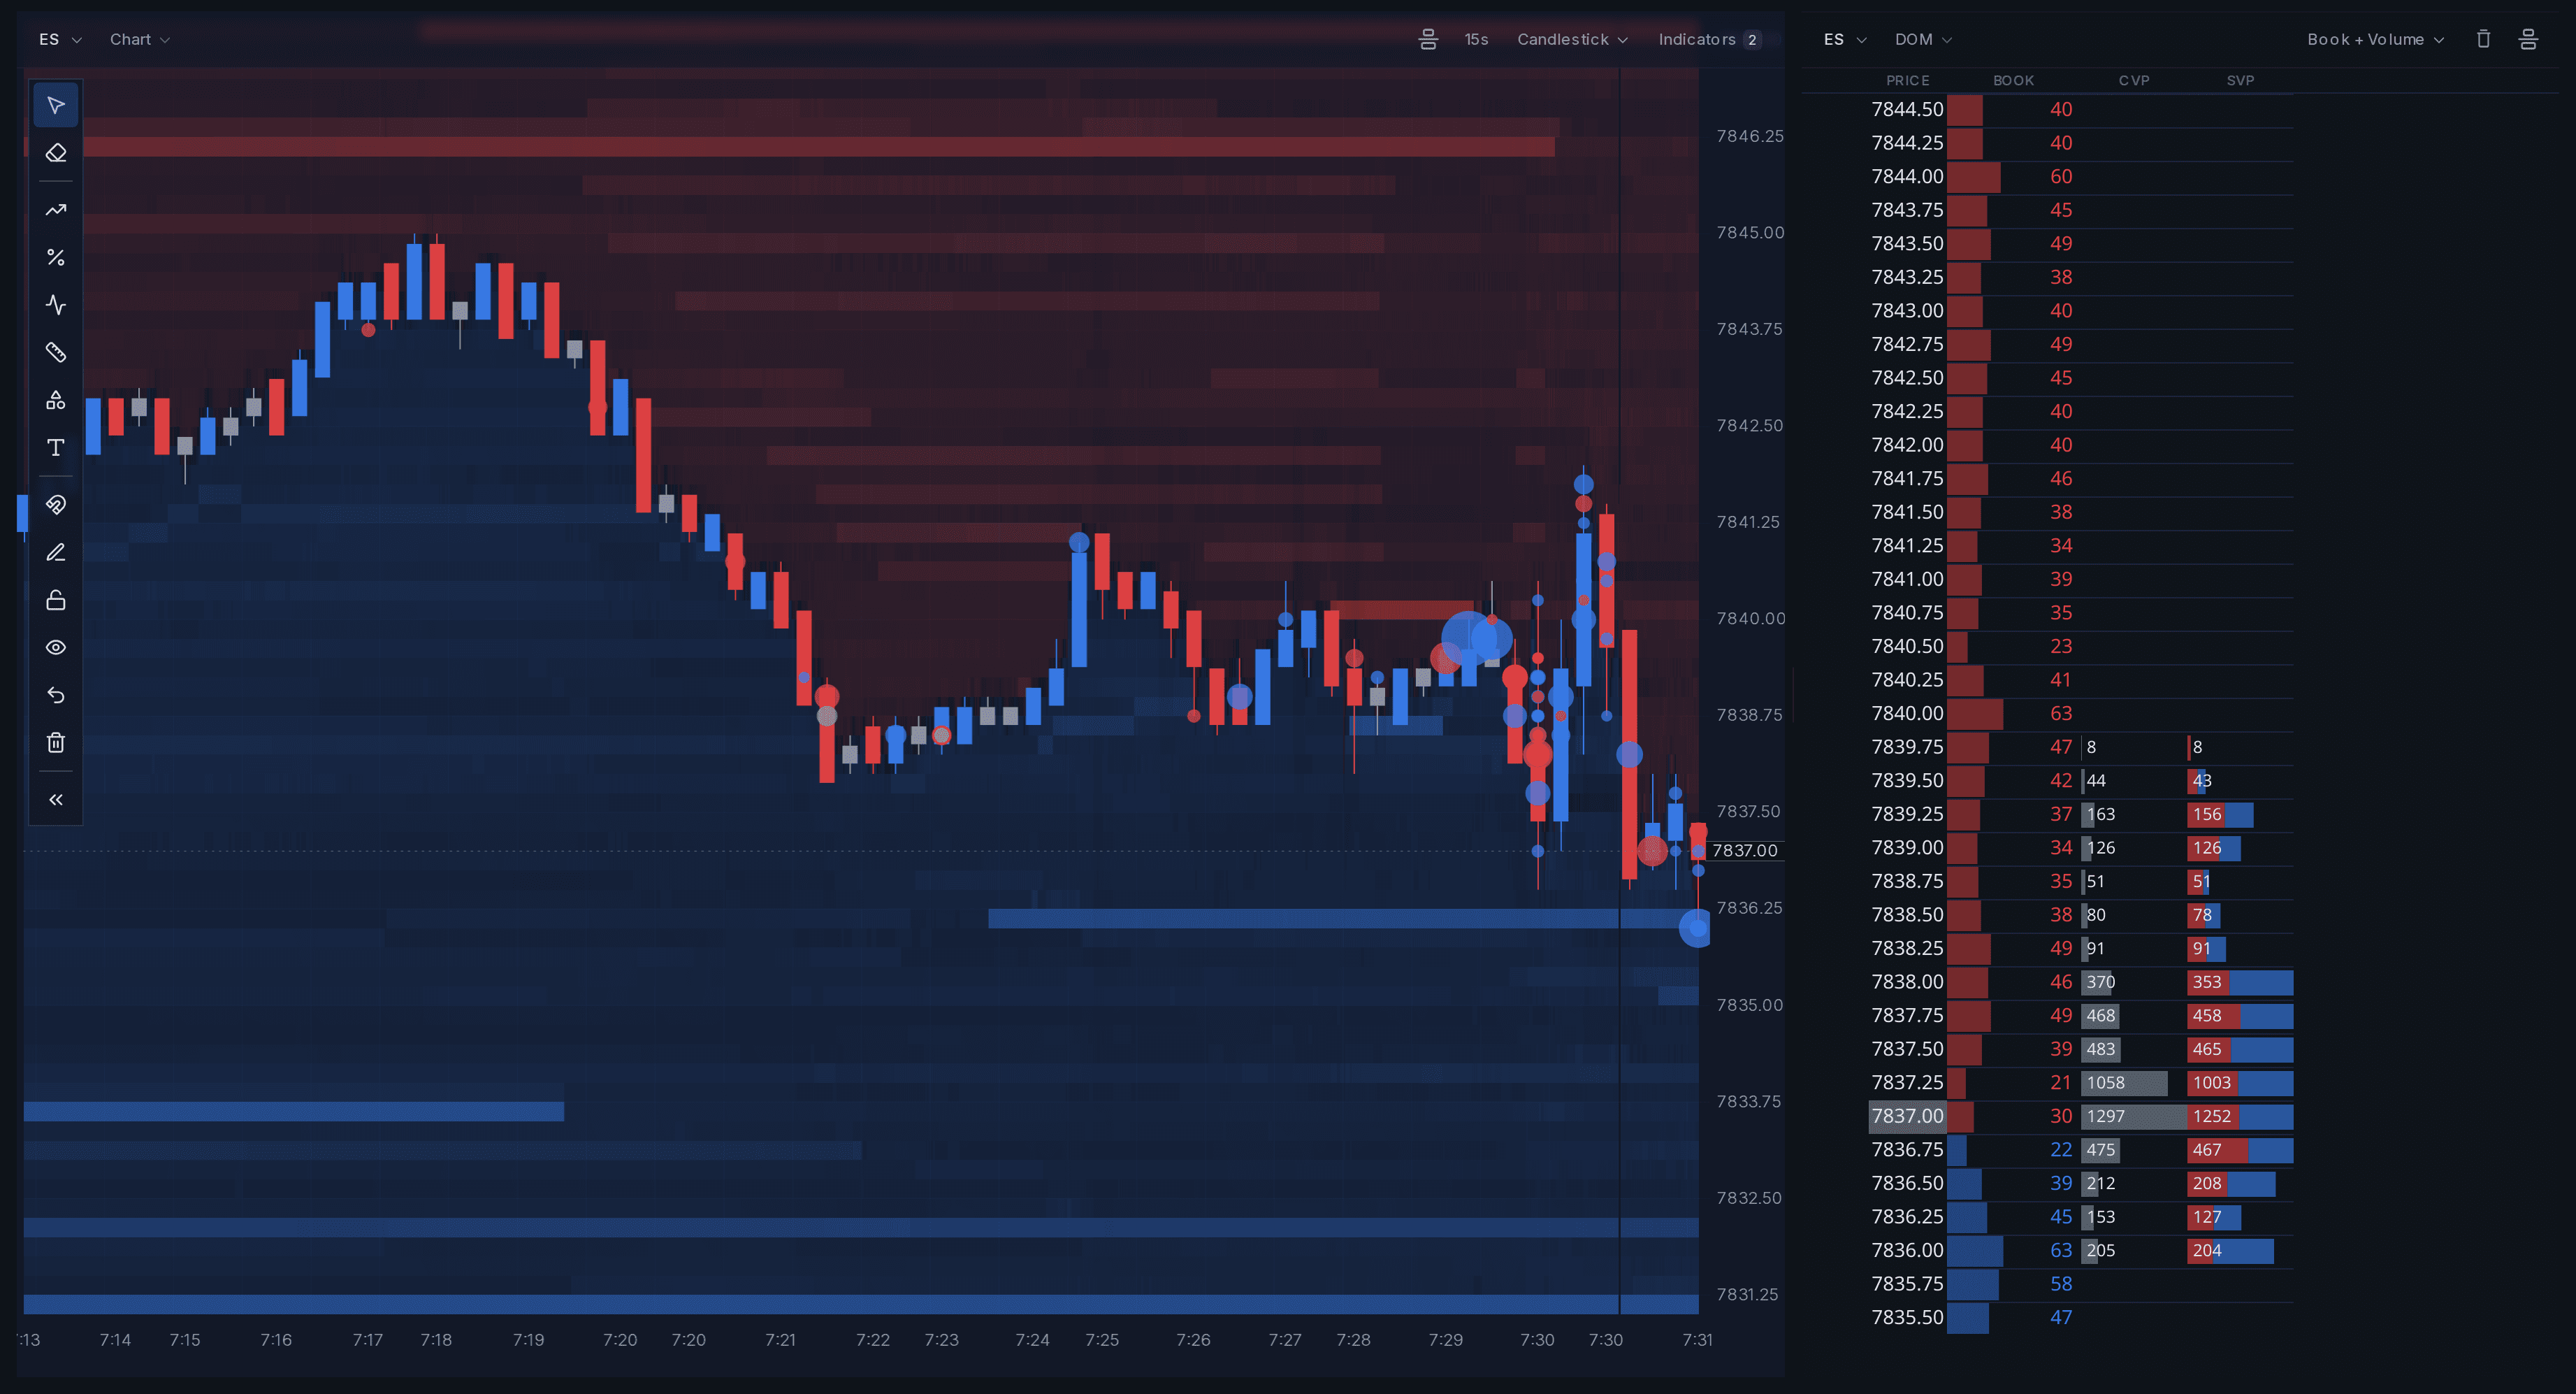
See the book
Resting liquidity as a heatmap, executions as bubbles, and the DOM side by side.
The footprint chart is code you can change
There is no fixed renderer behind these charts. Every number, every shaded row and the candle itself is drawn by a script you can open and edit. Pick a look, then read the code that produced it.
Every level shaded by how one-sided it traded.
Trade metrics
A quick view of replay activity and performance.
Time Replayed
12h 34m
Total session time
Trades Taken
87
Total completed trades
Win Rate
58%
Profitable trades / total
Weekly P&L
What traders say

MarketByOrder.com has become my go-to training ground for fast recaps and training sessions. What started as a DOM-only tool now gives me full access to DOM, footprint charts, and time & sales. Perfect for replaying sessions, testing trade ideas, and sharpening tape-reading skills. A must visite for anyone serious about discretionary trading.

This was an awesome tool to practice order flow. I have plenty of experience with the footprint but this tool really gave me some valuable experience in reading and understanding and practicing ladder entries and exits.

Finally, a platform that lets me replay the DOM without any data delay. I've used NinjaTrader and Sierra Chart, but both had lagging issues with order flow market replay. Now I can stop wasting hours troubleshooting and focus entirely on sharpening my trading skills.

Fantastic tool for new traders to get SIM experience, or seasoned pros to review specific events like unemployment numbers or FED days.
Instruments
Practice trading on real market replays.
Practice with DOM, footprint charts, time and sales, and performance tracking in one place.
We're happy to help
Contact Us
MarketByOrder is a fast growing application with updates every week – want to see something added? Send us an email.