Scalping ES on the DOM
The market is trending down into new lows. We'll step through a 2-minute ES DOM sequence and take a simple fade: watch for breakouts that slow down, then enter and exit on the previous high volume node. Then try it yourself on the replay below.
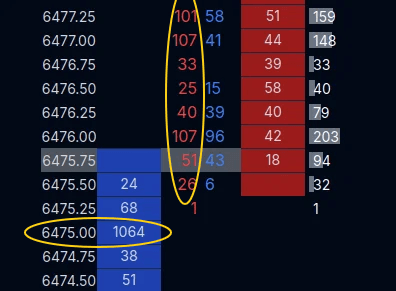
Here we have sell-side pressure but a huge wall of bids at 6475.00.
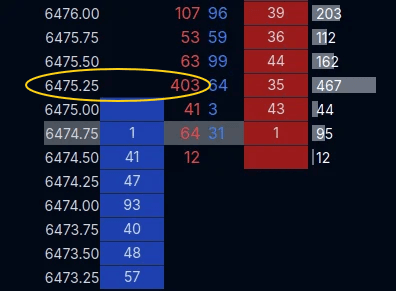
We see 403 contracts traded at 6475.25 - thats 1 tick higher than the 1000 bid wall. There was a massive iceberg and the visible bids were pulled completely. This is some big player tomfoolery and we expect this price to be revisited.
The chance of a breakout to the downside is high here, and we want to enter on a pullback.
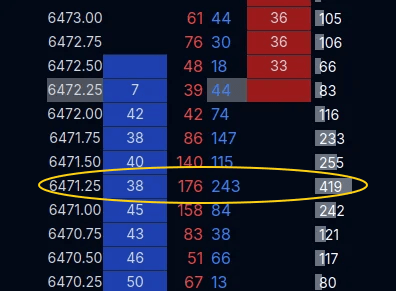
400 contracts traded here, somewhat neutral delta. A good place to buy and aim to exit at 6475.
Try it
0.24
0.23
0.22
0.21
0.20
0.19
0.18
0.17
0.16
0.15
0.14
0.13
0.12
0.11
0.10
0.09
0.08
0.07
0.06
0.05
0.04
0.03
0.02
0.01
0.00
-0.01
-0.02
-0.03
-0.04
-0.05
-0.06
-0.07
-0.08
-0.09
-0.10
-0.11
-0.12
-0.13
-0.14
-0.15
-0.16
-0.17
-0.18
There are a couple opportunities to fade the trend here. Be sure to keep a tight stop loss!