Orderflow replay
Replay the DOM, footprint chart and time and sales from a real past session, right in your browser. Pick an instrument and a time, press play, and practice reading orderflow at any speed. No need to record market data yourself.
Includes 5 minutes of replay time free daily, shared across up to 3 replays.
Replay without recording
Most orderflow platforms require you to record and store your own data before you can replay it. This can make it difficult to consistently practice. Replaying on-demand historical data lets you pick a particular time without having to prerecord it.
Market conditions vary day to day, but the open behaves very differently from midday. Practicing the same time of day is critical for consistency.
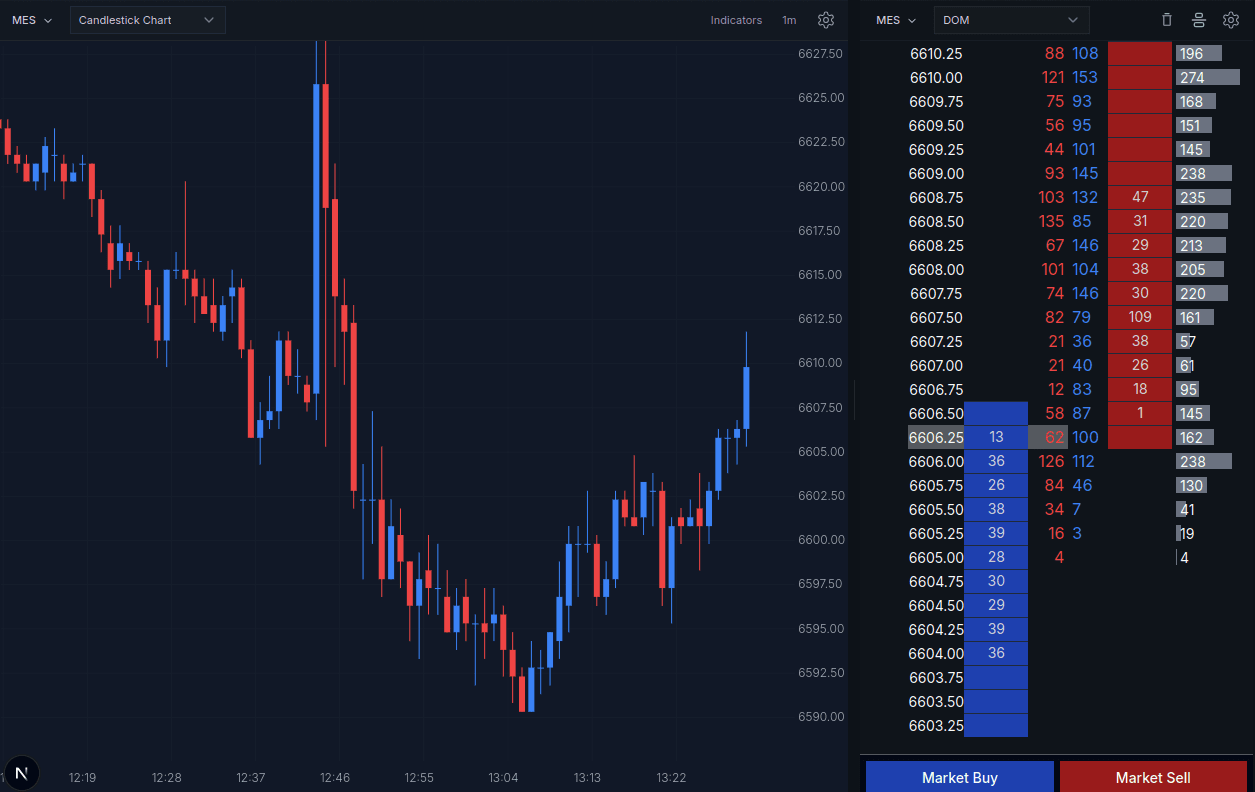
How a replay works
- Pick an instrument, a date and a start time, then press play. The DOM, the chart and the time and sales all move together, tick by tick.
- Change the speed from 0.01x to 16x. Slow a breakout down to see every trade, or speed through a quiet midday.
- Set the chart style to footprint, find something interesting, right click the bar and pick Replay from here. The replay jumps back to that minute and you watch it play out on the DOM next to the chart.
- Place simulated orders as it plays, then review the fills afterwards.
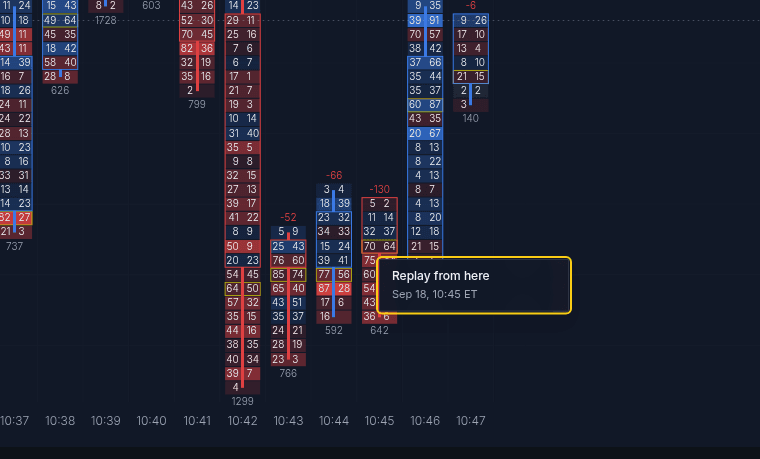
Three moments from one NQ session
Here is what some common chart events look like on the DOM, to get a better idea of how the market is behaving under the hood. Everything below is NQ on September 18, 2026, times in ET. Each link opens the replay at that minute so you can watch it yourself.
If you are new to the ladder, start with How to read the DOM, which covers each behavior on its own.
Absorption
At 10:42 sellers push price down to 29,704 on a delta of -331. The next three bars keep selling (-52, -66, -130) but price will not make a new low. At 10:46 buyers take over with +219 and price is back at 29,765 by 10:52.
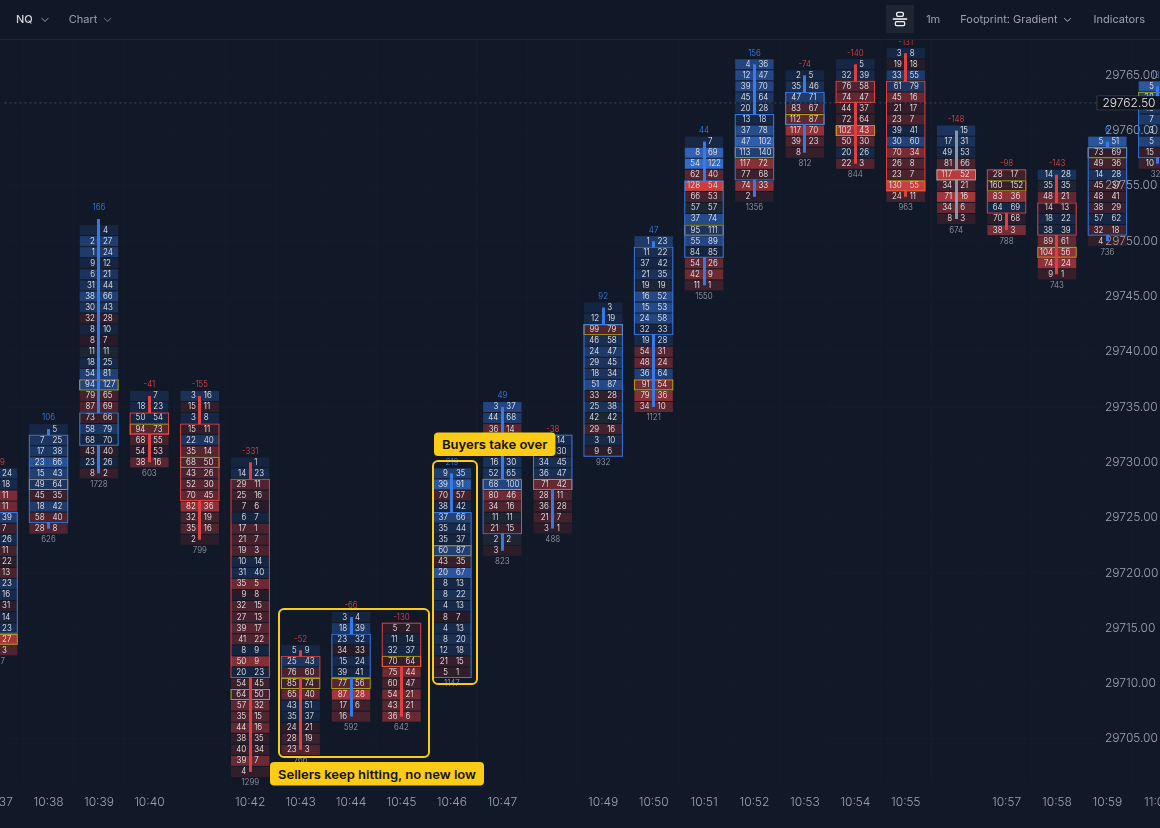
Replaying from 10:45, watch the bids just under price. Sellers keep hitting them and they keep filling back in, so the market orders never get through.
On the footprint chart this only shows up as heavy selling with no new low. On the DOM you can see why: the bid is being refilled as fast as it is hit. That is the thing to look for, not the size of any one print.
Replay this yourself from 10:40
Breakout
From 9:19 to 9:22 NQ holds under roughly 29,796. At 9:27 price flushes down to 29,745 and then reverses straight up, and the 9:28 bar opens right at the range high. By 9:31 price is at 29,845.
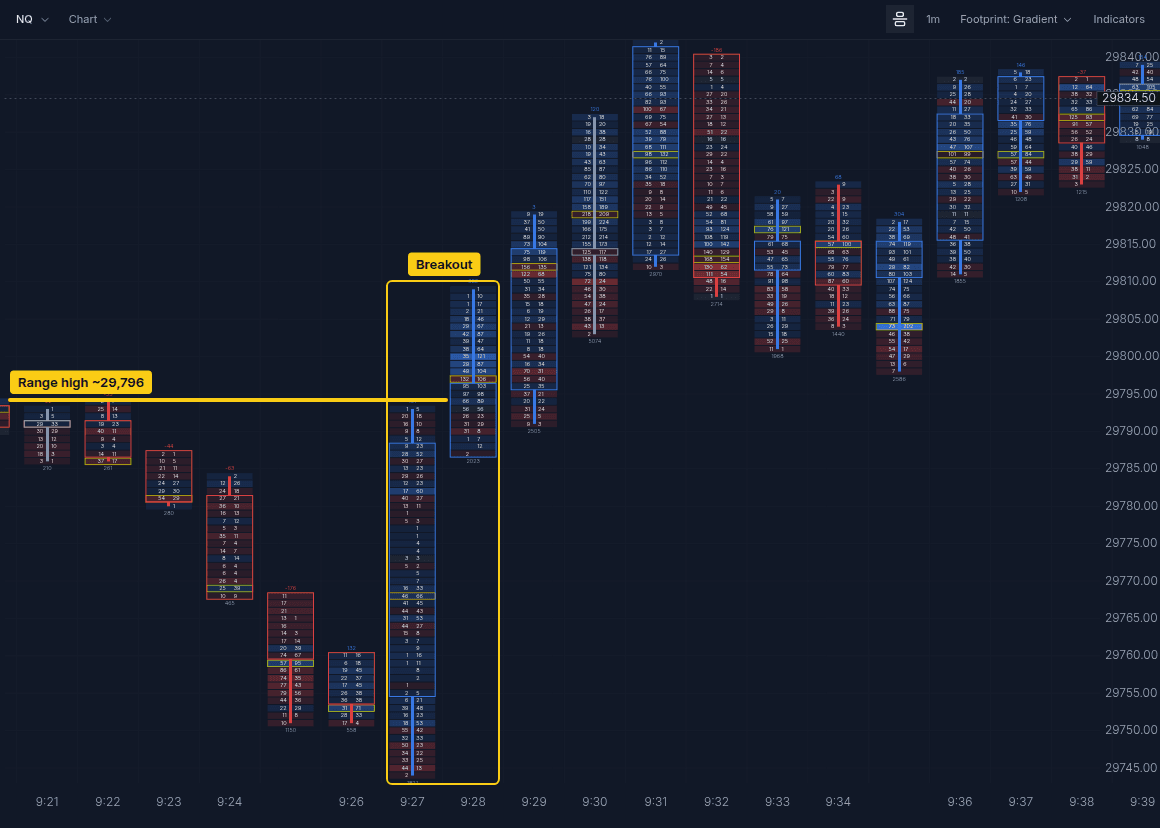
On the DOM the break is over almost instantly. The clip below is slowed to 0.1x: in the first fifth of a second of 9:28, buyers lift every offer from 29,788 up to about 29,798.
At 1x this is a blur, which is the point. A breakout like this is not something you react to on the DOM. The useful part is the minute before it: after the 9:27 flush, watch whether the offers above the range hold or start thinning out before the buyers arrive.
Replay this yourself from 9:20
Liquidity pull
At 10:01 price drops from about 29,783 to 29,751 on a delta of -325, and 10:02 carries it down to 29,729 on -381 with 2,339 contracts traded, the busiest bar of the morning.
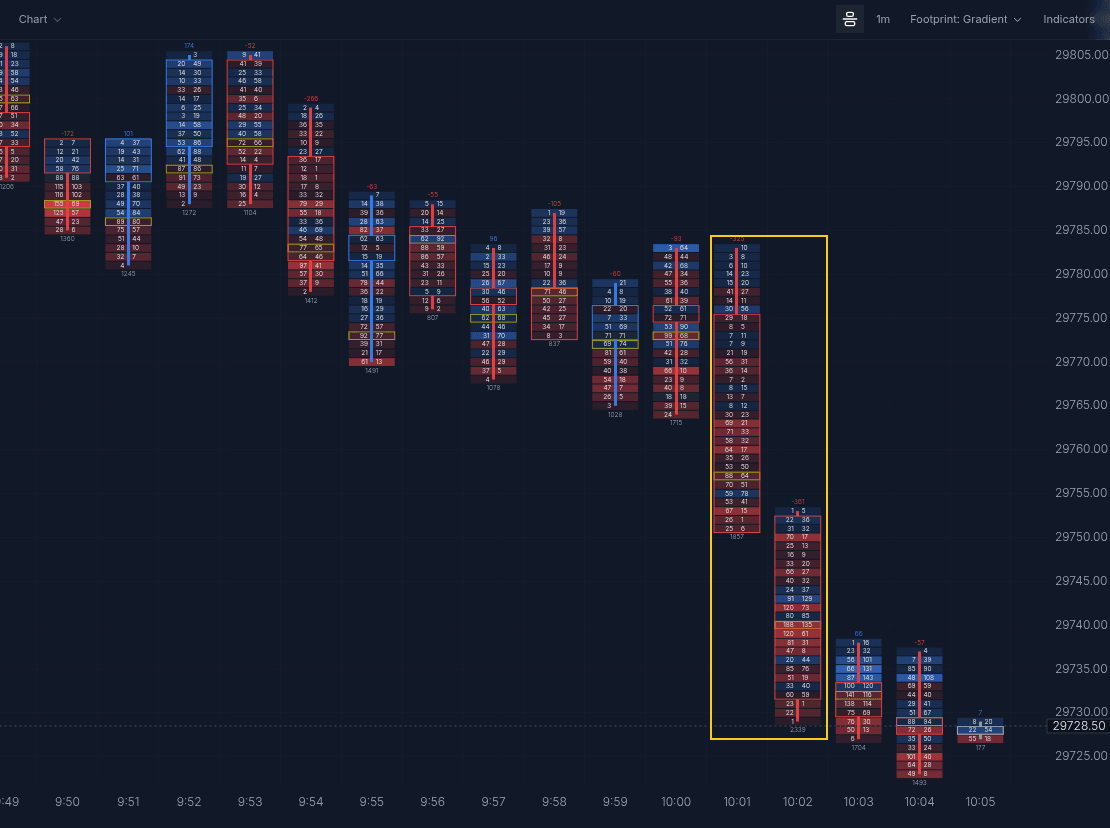
Replay from 10:01 and keep your eye on the bids under price rather than the prints. When buyers pull their limit orders, the size on the bid disappears before the selling arrives, and price falls through levels that looked supported a second earlier.
From 10:01:14 to 10:01:19 the best bid drops from 29,782 to 29,770, twelve points in five seconds, on only about a hundred contracts of selling.
This is the opposite of the absorption example. There the bid kept coming back after it was hit. Here it is gone before anyone hits it. On the footprint chart both look like a lot of selling, and the DOM is where you tell them apart.
Replay this yourself from 10:00
A practice routine
Trade within a fixed time window. In this example, the session is limited to 15 minutes.
Spend the first few minutes observing. Look at the market orders in the center columns - how many trades occur before price moves?
The goal is not to predict direction, but to understand how price moves through different areas of liquidity.
Based on our 15 minute window of concentration, we expect to make trades that last less than 1 minute. Given current market conditions and volatility our profit target and stop loss should reflect that.
In the example below, the circled areas are regions where price previously moved with little resistance. We expect price to move quickly through these areas. Our stop loss is placed just above the lower zone - we don't want to get run over on the downside. Our take profit is positioned about 5 ticks above the upper zone - we do want to capture the movement above if it runs.
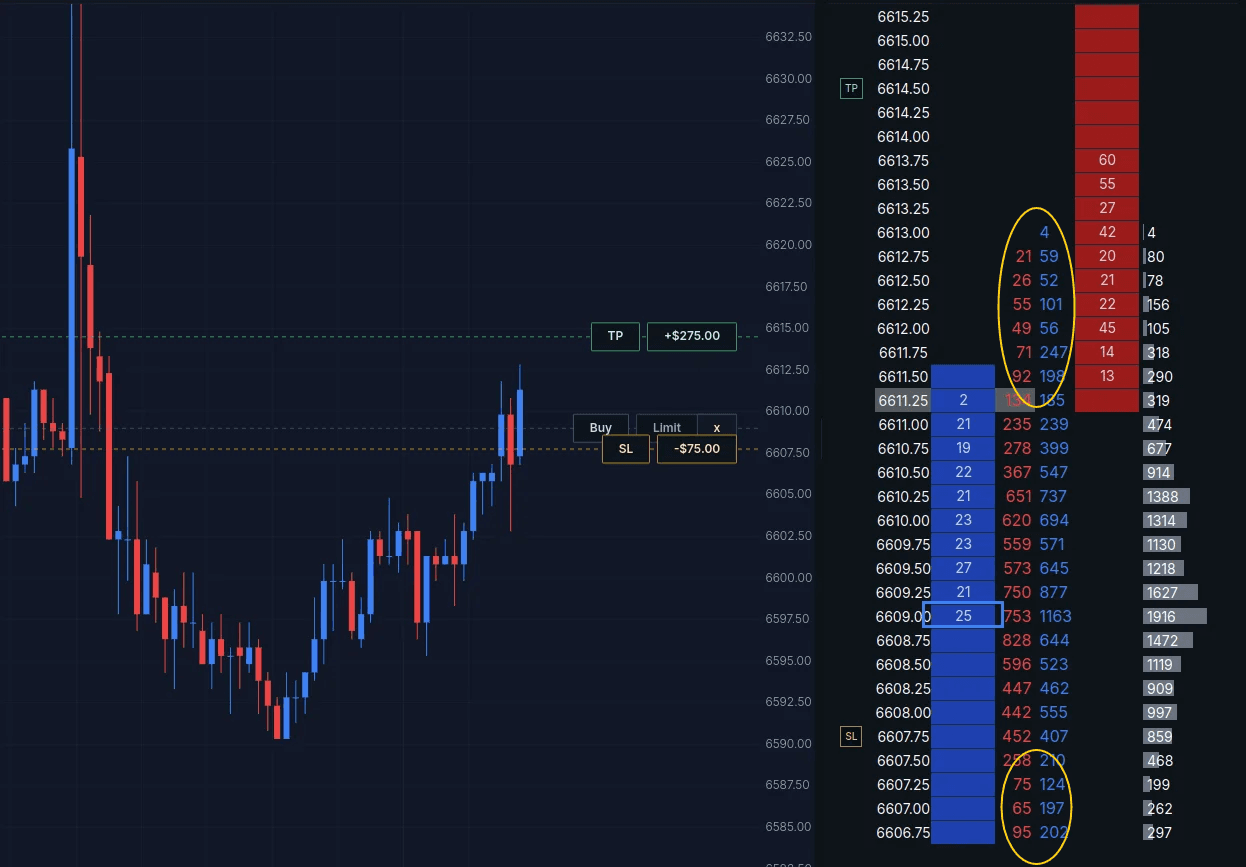
DOM skill is built through controlled repetition, not live randomness. Pick a session, constrain time, and study how price moves through liquidity. Do that daily.
What you can replay
Full depth for 18 futures, with no data subscription needed: 6E, BTC, CL, ES, FDAX, GC, M2K, M6E, MES, MGC, MNQ, MYM, NG, NQ, RTY, SI, YM, ZN.
Want an instrument or a date we do not carry? Connect your own Databento key and pay Databento for what you request. The instruments page lists everything you can load.
Questions
Do I need to record market data first?
No. The history is already stored, so you pick a date and a start time and the replay begins there. There is nothing to leave running and no files to manage.
Do I need to pay for market data?
Our historical market data is included in the daily preview and paid plans. If you want an instrument or a date we do not carry, you can connect your own Databento key and pay Databento separately for what you request.
Is replay free?
Every account gets 5 minutes of replay time free daily, shared across up to 3 replays. Pro removes the daily limit.
Can I place trades during a replay?
Yes. Place simulated orders on the DOM or the chart while the replay plays, and review the fills and your P&L afterwards.
Comparing tools? See how replay works next to Bookmap, DeepCharts, TradingView and FX Replay.