How to read the DOM
Real examples from one NQ session, each one ready to replay.
Learning to read the DOM is less about memorizing patterns and more about watching how orders behave over time.
Most people arrive at orderflow through a chart. Candles first, then a footprint, then indicators stacked on top. The ladder is a better place to begin, because it shows the thing every other tool is a summary of: the orders resting in the book right now, and the trades hitting them.
Includes 5 minutes of replay time free daily, shared across up to 3 replays.
Reading the ladder
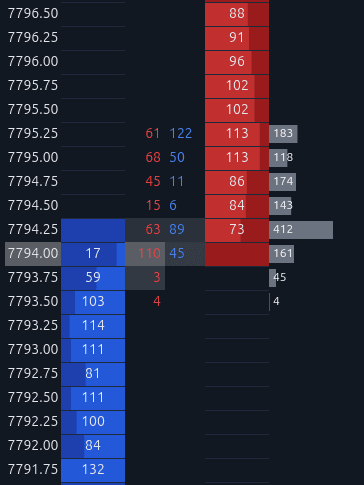
Read the ladder outwards from the price column. Resting bids sit on the left in blue, resting asks on the right in red, and the two center columns are the trades that actually printed at each price: sells hitting the bid, buys lifting the offer. The far right column is total volume traded at that price.
The Time and Sales sits next to the ladder and lists every trade as it prints, with the time, the price and the size. Buys are blue and sells are red.
The examples below are all NQ on September 18, 2026, times in ET, with the chart, the DOM and the Time and Sales side by side.
One market order, six prices
At 9:30:40 a market buy order for 20 contracts enters the market. On the Time and Sales, this prints as a single row: 20 contracts from 29,815.25 to 29,816.50. On the DOM, that order does not fill at a single price. Instead, it trades against the resting offers across several price levels. In this case, there were 1, 2, 8, 4 and 4 contracts available at successive price levels, and the last contract filled at a sixth. The buy order traded through those offers, exhausting the available liquidity and pushing price higher as a result.
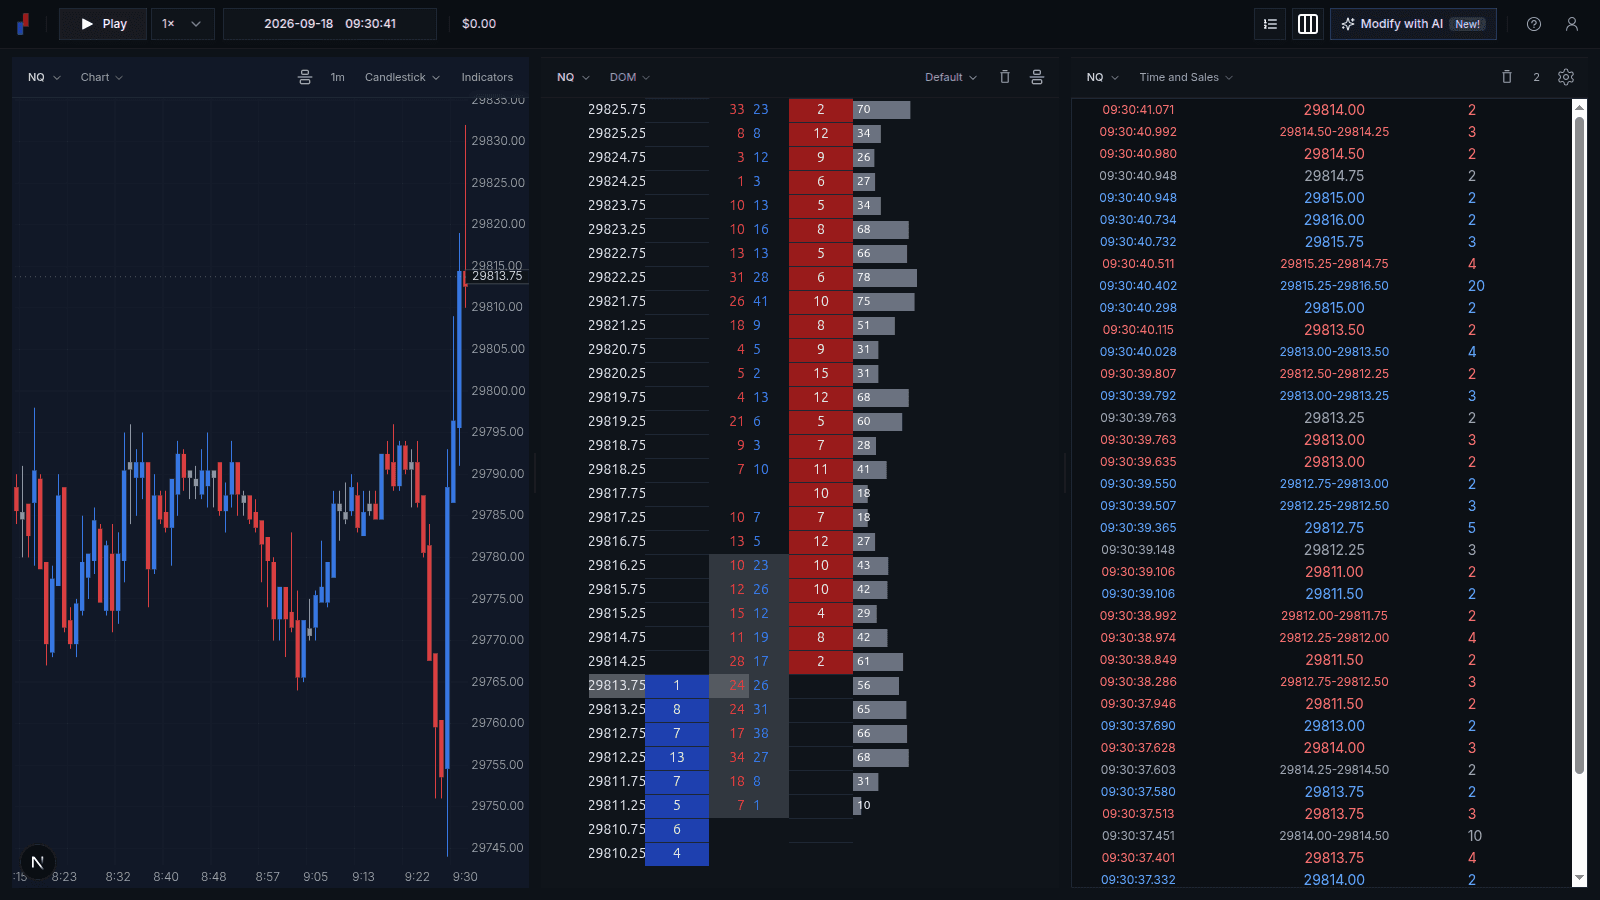
Replay this yourself from 9:30:30
Slippage shows where the liquidity is
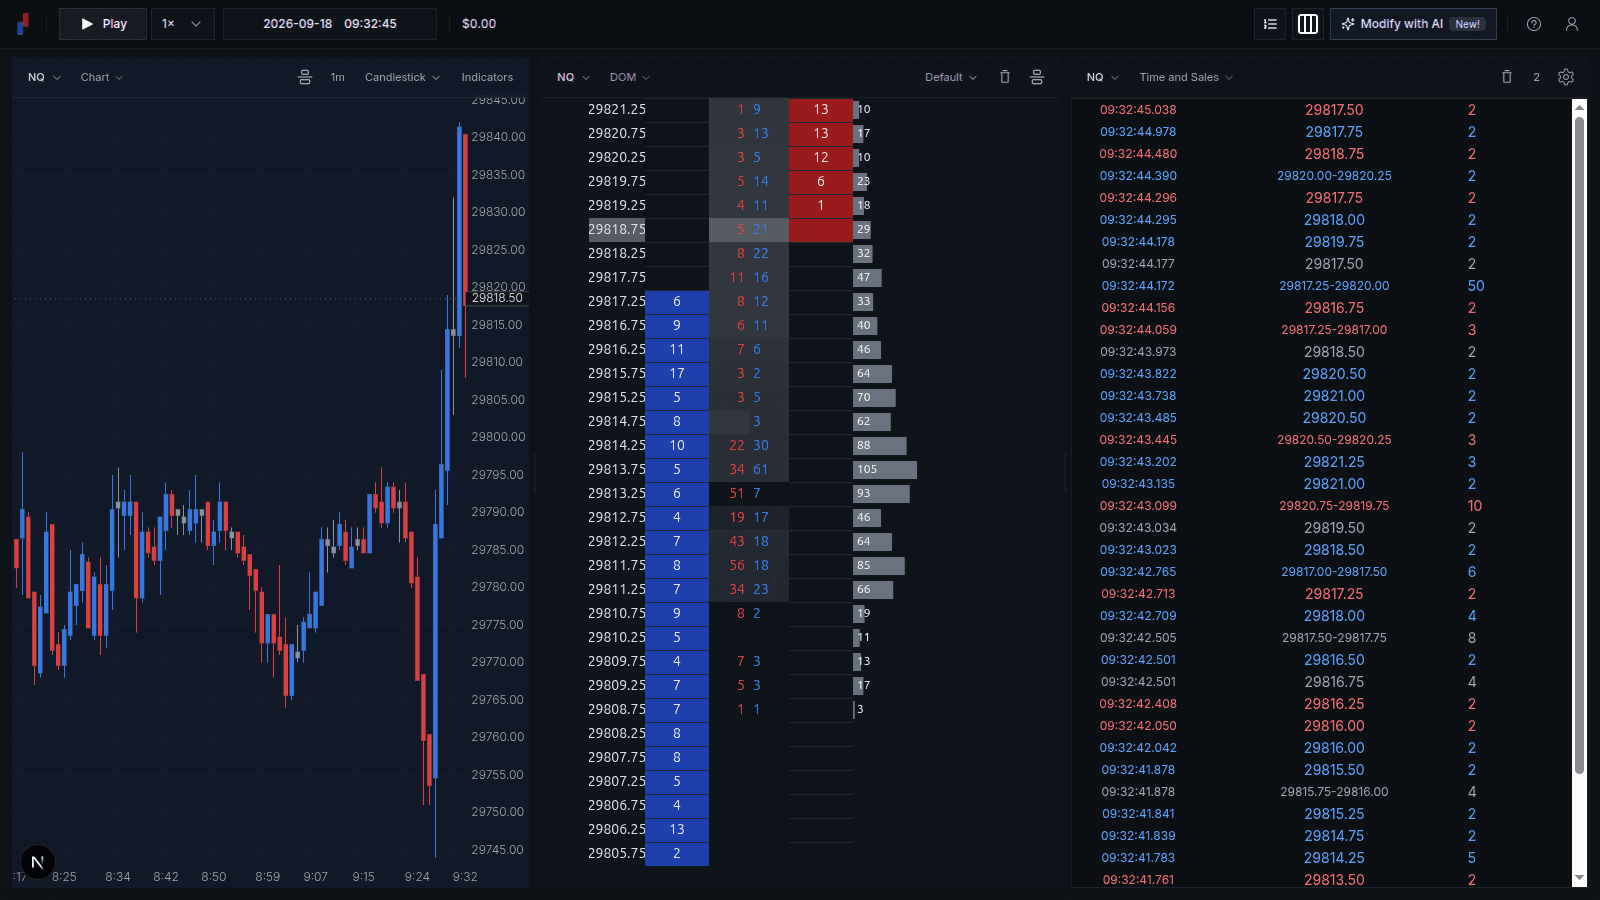
At 9:32:44 a 50 contract buy prints from 29,817.25 to 29,820.00, eleven ticks of slippage.
Less than three minutes later, at 9:35:13, a 64 contract buy fills entirely at 29,804.50, and a 38 contract buy fills at the same price a third of a second after it. Similar size, no slippage at all.
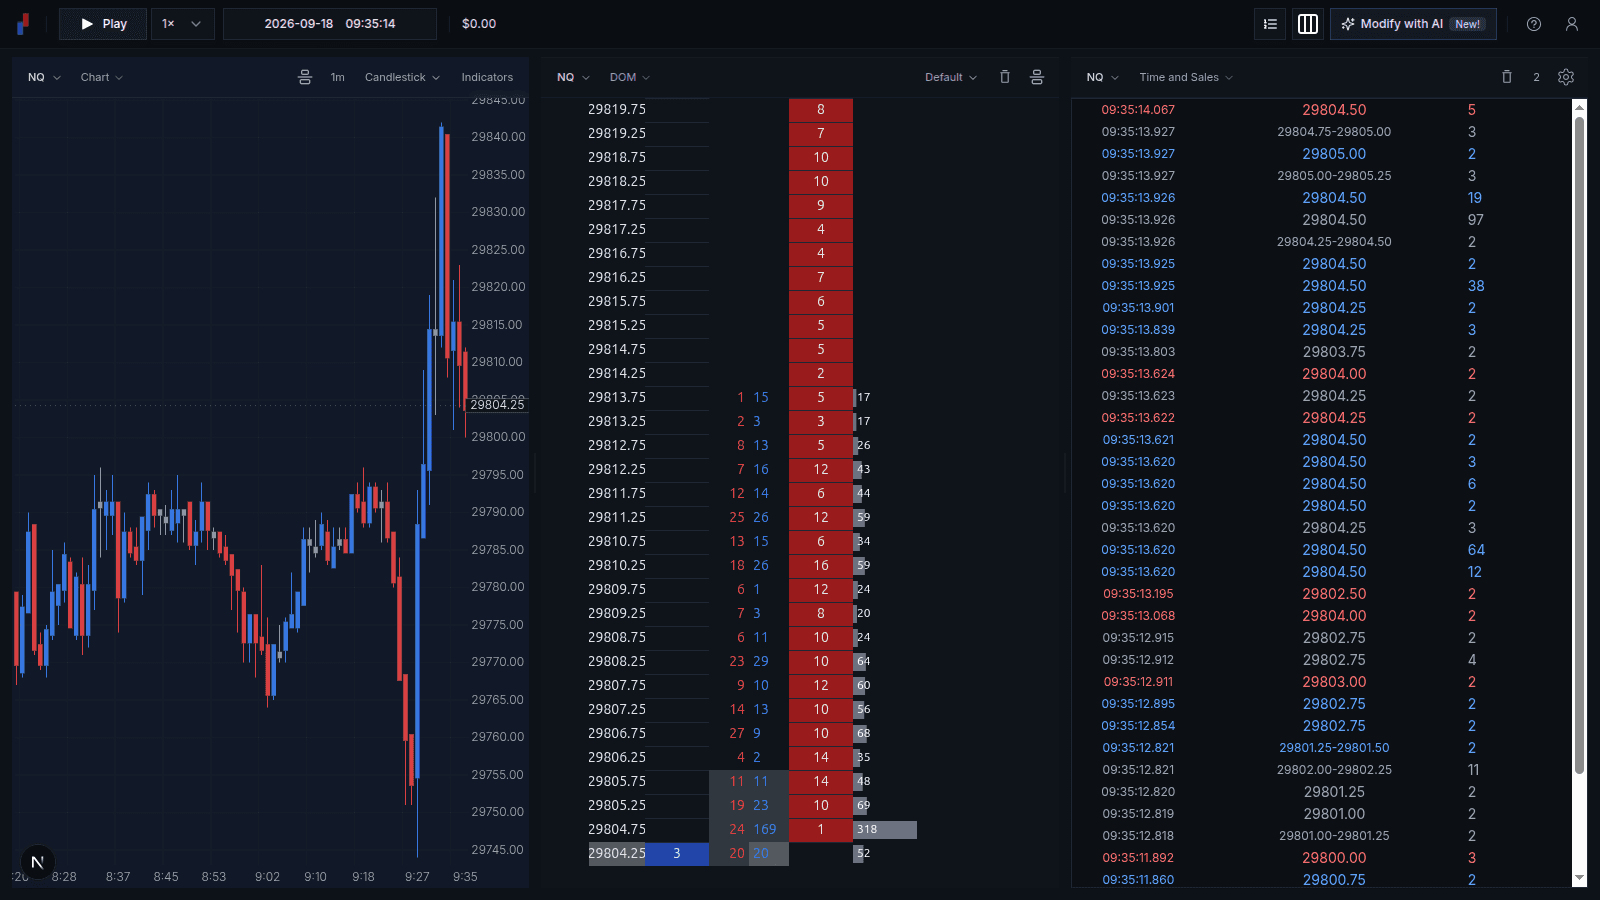
The orders are not what changed. The book is. When a buy of this size moves price eleven ticks, there is little resting on the offer, and when it moves price not at all, someone is sitting there with size. You can read that from the Time and Sales alone, before you look at the ladder.
Replay this yourself from 9:32:35
Hidden size and icebergs
At 10:56:22 sellers hit 29,756.00 with 45 contracts in a single millisecond, while the bid at that price never showed more than 11. The rest was hidden. An iceberg order allows traders and investors to hide volume behind a visible order: only part of the size shows, and the visible part refills as it trades.
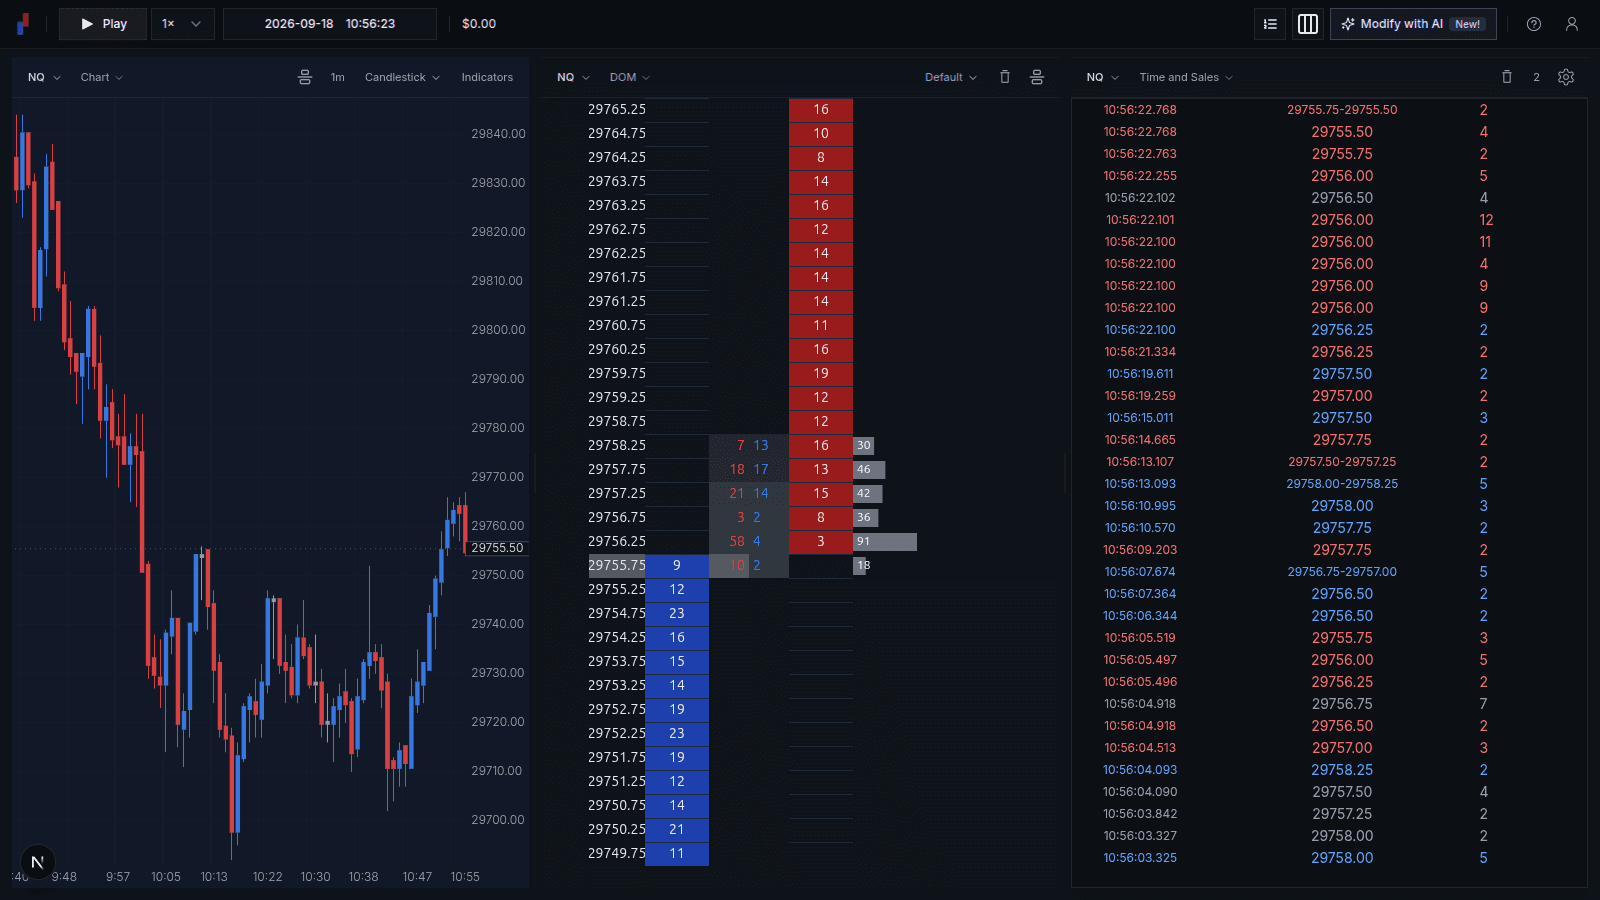
Half a second later price traded lower anyway. This behavior analyzed on its own lacks any directional bias, however given context it can.
Replay this yourself from 10:56:15
Absorption
Absorption is simply when a limit keeps stacking or filling at a price level. Most of the time this is caused by iceberg orders. This behavior can typically be found at support and resistance levels, and anywhere in between. Most execution algos are liquidity seeking. While this could possibly indicate a reversal, it could also just be happy traders.
For a longer example, the absorption at the NQ lows at 10:45 shows sellers hitting the bid for three bars while it keeps filling back in.
Stacking and pulling
Pulling and stacking is when limit orders are either added to or removed from the book. More sellers stacked on the offer can push price down; more buyers stacked on the bid can push it up.
A pull is the opposite of absorption. The size on the bid disappears before the selling arrives, and price falls through levels that looked supported a second earlier. The liquidity pull on NQ at 10:01 shows the best bid dropping twelve points in five seconds on only about a hundred contracts of selling.
The question you are really asking
On this timeframe the question is not where the market is going. It is where someone big is working, and how much they still have left to do. Both sides are playing that game at once, hiding intent from each other, which is what makes the tape look like noise.
There is no if this, then that. You cannot memorize a rulebook for it. You absorb the behavior by watching one instrument closely and by putting on trades, because being in a position changes what you notice.
A drill: one tick scalps on ES
Pick ES and trade for a single tick. Every time you see absorption, place a limit order at that price. Absorption is size being traded into a level without the level giving way.
In the ladder at the top of this page, 110 contracts sold into the bid at 7794.00 and price did not break below it. The sellers spent real size and got nothing for it, while a bid was still sitting there afterwards. That is the moment to place your own bid.
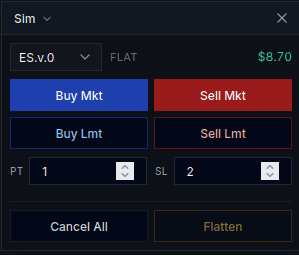
Set a profit target of 1 tick and a stop of 2, and stay in Sim while you are learning. The small target is not about the money. It is about repetition: you want to be in a position often enough to feel the difference between a level that is holding and one that is about to give.
What to watch for
- Heavy trades printing into a price where the resting size does not disappear
- A bid or offer refilling as fast as it is hit
- Price stalling on a level immediately after a fast move into it
- Size vanishing before any trades print, which is the opposite signal: nobody is absorbing, they are getting out of the way
Trade a session like this, then go back to the footprint chart. The candles start reading like a record of the same behavior, because that is exactly what they are.
Questions
What is the DOM?
The DOM, or depth of market, is a ladder of prices showing the limit orders resting at each one and the trades that print against them. Bids sit below the market and offers sit above it.
What is the difference between the DOM and a footprint chart?
A footprint chart records what traded inside each candle after the fact. The DOM shows what is resting in the book right now, and it changes every time an order is added, pulled or filled.
What is an iceberg order?
An order that shows only part of its size. When the visible part fills, more appears at the same price, so more contracts trade there than the book ever showed.
What is absorption?
Heavy trading into one price without the price giving way, usually because the resting side keeps refilling as it is hit.
What is the difference between stacking and pulling?
Stacking is limit orders being added to the book. Pulling is limit orders being removed before they trade. More sellers stacked on the offer can push price down; more buyers stacked on the bid can push it up.
Do I need to record market data to practice reading the DOM?
No. Past sessions are already stored, so you pick a date and a start time and replay the DOM from there.
More
- Orderflow replay: three moments from the same NQ session, found on the footprint chart and replayed on the DOM.
- Top of book vs market depth
- How to use the DOM: placing and moving orders, and the DOM settings.
- Time and Sales settings