TradingView Bar Replay vs Tick Replay: Practice Order Flow
TradingView bar replay is how most traders first use bar replay to practice: pick a start point, press play, and trade the chart as it unfolds. It works well for reading candles. It stops at the candle, though. The trades inside each bar and the resting orders around price are not part of the replay.
MarketByOrder is tick replay for futures in the browser. It plays back every trade and every change to the order book, tick by tick, in the order it happened. You watch the footprint chart and the DOM build in real time and place orders against them. Try up to 3 replays a day with 5 minutes of total replay time free.
Quick Comparison
| Feature | TradingView | MarketByOrder |
|---|---|---|
| What the replay steps through | Whole bars (1 second updates on Premium+) | Every tick: each trade and order book change |
| Footprint chart in replay | No (not supported in replay) | Yes, built trade by trade |
| Buy / sell volume | Inferred from price movement inside the bar | Aggressor side reported by the exchange |
| DOM in replay | No (live, through a broker only) | Yes, with stacking and pulling |
| Time & sales in replay | No | Yes |
| Order book heatmap | No | Yes |
| Orders in replay | Market, limit, stop, stop-limit | Market, limit, stop, brackets |
| Trade results saved | Session only (exportable) | Yes, logged to your dashboard |
| Scripting | Pine Script, no order book access | TypeScript, with every trade and the order book |
| Drawing tools | 100+ | 71 |
| Volume profile and regression drawings in replay | Inactive | Yes |
| Markets | Stocks, forex, crypto, futures | CME futures |
| Price for second-level replay | Premium, $59.95/mo billed yearly | Pro, $14/mo |
| Price for tick replay | Ultimate, $199.95/mo billed yearly, last 7 days | Pro, $14/mo |
TradingView prices from their pricing page, October 2026.
How Realistic Is the Replay?
TradingView: one bar at a time
TradingView's bar replay help page says the replay moves forward a bar at a time and that you can't replay bars in smaller segments. Premium and above can set a 1 second update interval, so a bar fills in second by second. Tick replay is Ultimate only, and only for the last 7 days (replay data limits).
There is also a known issue with higher timeframes. Step a few bars into a replay, switch to a higher timeframe, and the last candle shows the high, low and close of the whole period, including the part you haven't replayed yet. Community scripts such as Multi Timeframe Bar Replay Fix and Replay time-fix last candle exist only to hide that candle.
FX Replay runs on TradingView's charts too, so its replay also steps through candles. See FX Replay vs MarketByOrder.
MarketByOrder: tick by tick
MarketByOrder replays the session from exchange data: each trade, each order added to or pulled from the book. Candles, the footprint and the DOM are all built from that stream as it plays, so nothing on screen knows about a trade that hasn't happened yet. Change timeframe mid-replay and the current candle still ends at the replay clock.
Footprint Charts
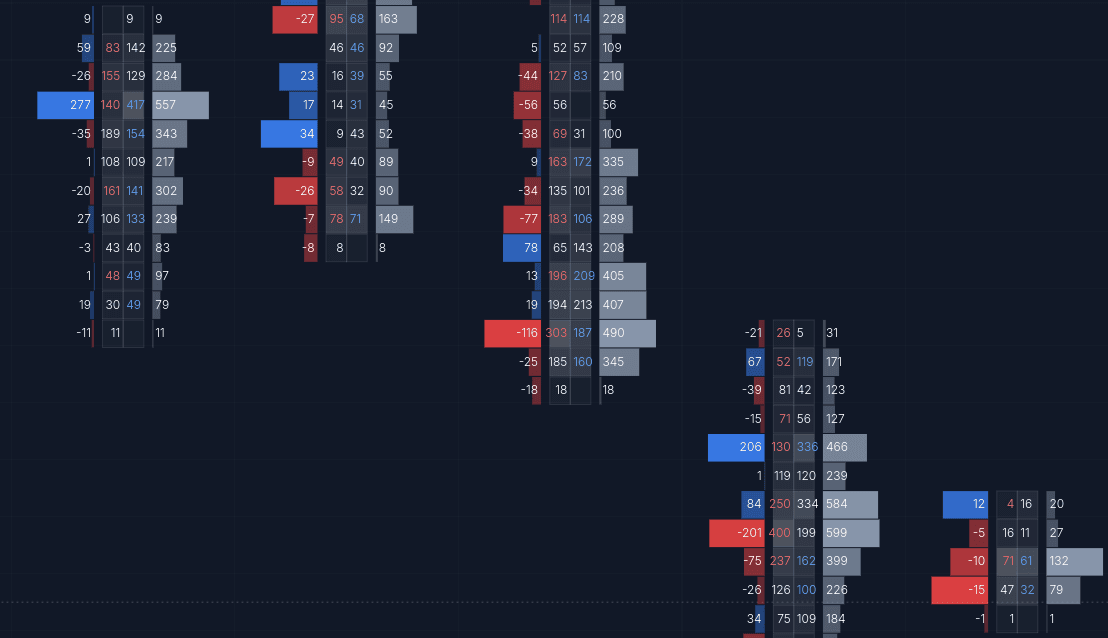
TradingView has a volume footprint chart type, but it is on the list of chart types that don't support replay. Outside the replay it splits buy and sell volume by looking at price movement inside the bar, using tick data only on the professional plans.
In MarketByOrder the footprint chart is the replay. Each trade lands at its price as it prints, on the bid or ask side the exchange reported, so you see delta and imbalances form inside the bar instead of after it closes.
The DOM
TradingView shows a DOM only when a broker is connected, and only for the live market. Bar replay has no order book. The DOM scripts in its community library rebuild one from traded volume, so they never show resting limit orders.
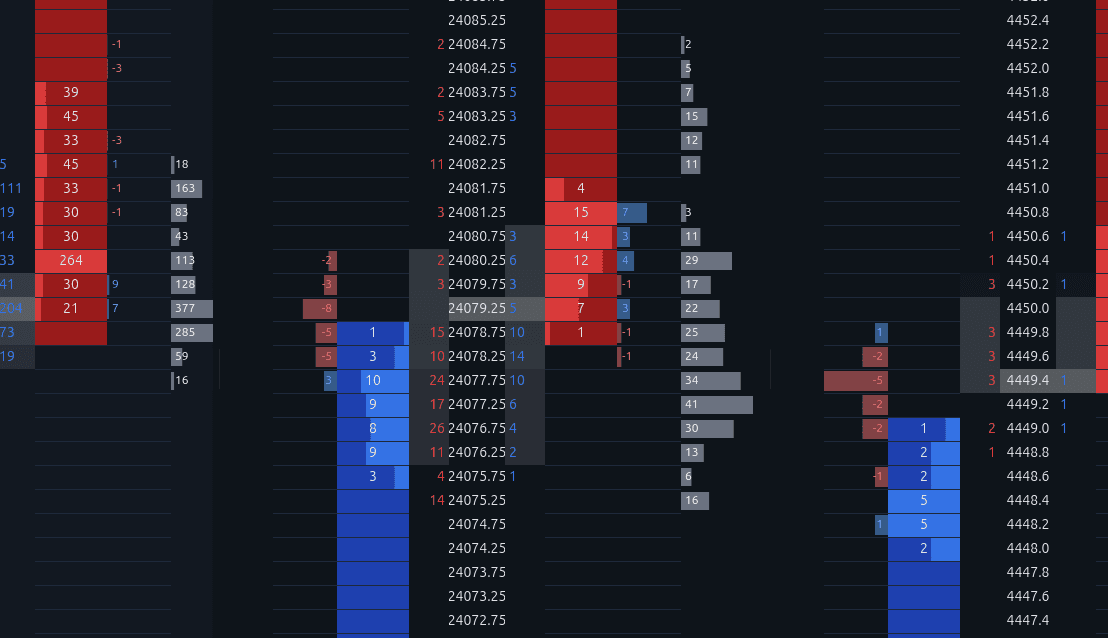
MarketByOrder replays the order book itself. The DOM shows the size resting at each price, with Stack and Pull columns for where size is being added or removed, and you can click the ladder to place limit and stop orders that fill against the replayed trades.
Drawing Tools
TradingView has the bigger set, but two of its drawings, regression trend and fixed range volume profile, are inactive during replay.
MarketByOrder has 71 drawing tools: trend lines, channels and pitchforks, Fibonacci and Gann, chart patterns and Elliott waves, long and short positions, anchored VWAP, fixed range and anchored volume profiles, shapes and notes. All of them work while the replay plays.
Scripts
Pine Script works from bars. It can pull lower timeframe data into a bar, but it can't read the order book, which is why the DOM scripts above have to guess.
MarketByOrder scripts are TypeScript, written in an editor inside the app. A script can read every trade, the order book at any moment, and volume at each price, and it runs as the replay plays. Indicators, chart styles, DOM layouts and algos are all scripts, including the built-in ones, so you can duplicate any of them and change how it works. The script API docs list everything a script can read.
Trading Inside the Replay
TradingView added trading in bar replay in 2022, with market, limit, stop and stop-limit orders and take profit and stop loss dragged on the chart. The results last for the session and can be exported. Paper Trading and broker orders placed during a replay fill at live prices, not replayed ones.
In MarketByOrder every order fills against the replayed trades, from the DOM or the chart, with brackets attached. Each trade is logged to your dashboard, so time replayed, win rate and daily P&L carry across sessions.
Where TradingView Is Ahead
- Markets: stocks, forex, crypto and futures, against CME futures here.
- History: decades of bar data on Premium and above.
- A large community library of Pine Script indicators.
- Alerts and native mobile apps.
If you practice from candles across many markets, TradingView bar replay covers it. If you want to practice reading the order flow behind the candle, that is what MarketByOrder replays.