New to orderflow trading? Start with the DOM.
Most people arrive at orderflow through a chart. Candles first, then a footprint, then indicators stacked on top. The ladder is a better place to begin, because it shows the thing every other tool is a summary of: the orders resting in the book right now, and the trades hitting them.
Short timeframes are not just for the algos
You will hear that short timeframes belong to the algos. It sounds like caution, but it is mostly wrong. High frequency trading is largely arbitrage and market making, buying in one venue and selling in another inside a few microseconds. That is not the trade you are in when you hold something for forty seconds.
What actually drives the seconds to minutes timeframe is liquidity. Large participants need to accumulate or offload size without moving the market against themselves, and their algos work orders into the book quietly to do it.
The question you are really asking
On this timeframe the question is not where the market is going. It is where someone big is working, and how much they still have left to do. Both sides are playing that game at once, hiding intent from each other, which is what makes the tape look like noise.
There is no if this, then that. You cannot memorize a rulebook for it. You absorb the behavior by watching one instrument closely and by putting on trades, because being in a position changes what you notice.
The drill: one tick scalps on ES
Pick ES and trade for a single tick. Every time you see absorption, place a limit order at that price. Absorption is size being traded into a level without the level giving way.
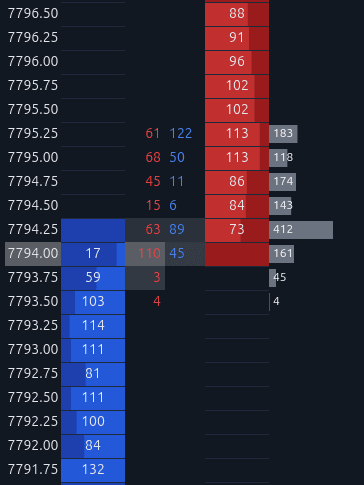
Read the ladder outwards from the price column. Resting bids sit on the left in blue, resting asks on the right in red, and the two center columns are the trades that actually printed at each price: sells hitting the bid, buys lifting the offer. The far right column is total volume traded at that price.
At 7794.00, 110 contracts sold into the bid and price did not break below it. The sellers spent real size and got nothing for it, while a bid was still sitting there afterwards. That is the moment to place your own bid.
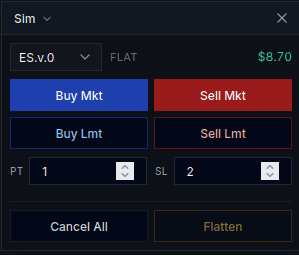
Set a profit target of 1 tick and a stop of 2, and stay in Sim while you are learning. The small target is not about the money. It is about repetition: you want to be in a position often enough to feel the difference between a level that is holding and one that is about to give.
What to watch for
- Heavy trades printing into a price where the resting size does not disappear
- A bid or offer refilling as fast as it is hit
- Price stalling on a level immediately after a fast move into it
- Size vanishing before any trades print, which is the opposite signal: nobody is absorbing, they are getting out of the way
Trade a session like this, then go back to the footprint chart. The candles start reading like a record of the same behavior, because that is exactly what they are.
Try this setup