DOM Replay
Here we will look at what some common chart events look like on the DOM, to get a better idea of how the market is behaving under the hood. Everything below is NQ on September 18, 2026, times in ET.
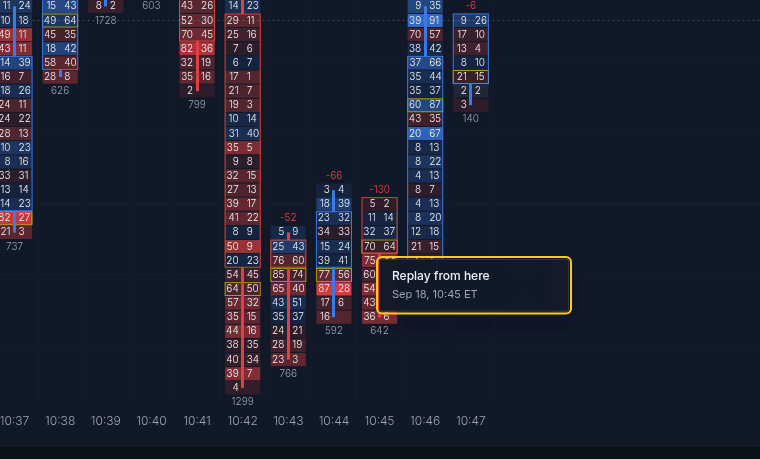
The workflow is the same each time. Set the chart style to footprint, find something interesting, right click the bar and pick Replay from here. The replay jumps back to that minute and you watch it play out on the DOM next to the chart.
Absorption
At 10:42 sellers push price down to 29,704 on a delta of -331. The next three bars keep selling (-52, -66, -130) but price will not make a new low. At 10:46 buyers take over with +219 and price is back at 29,765 by 10:52.
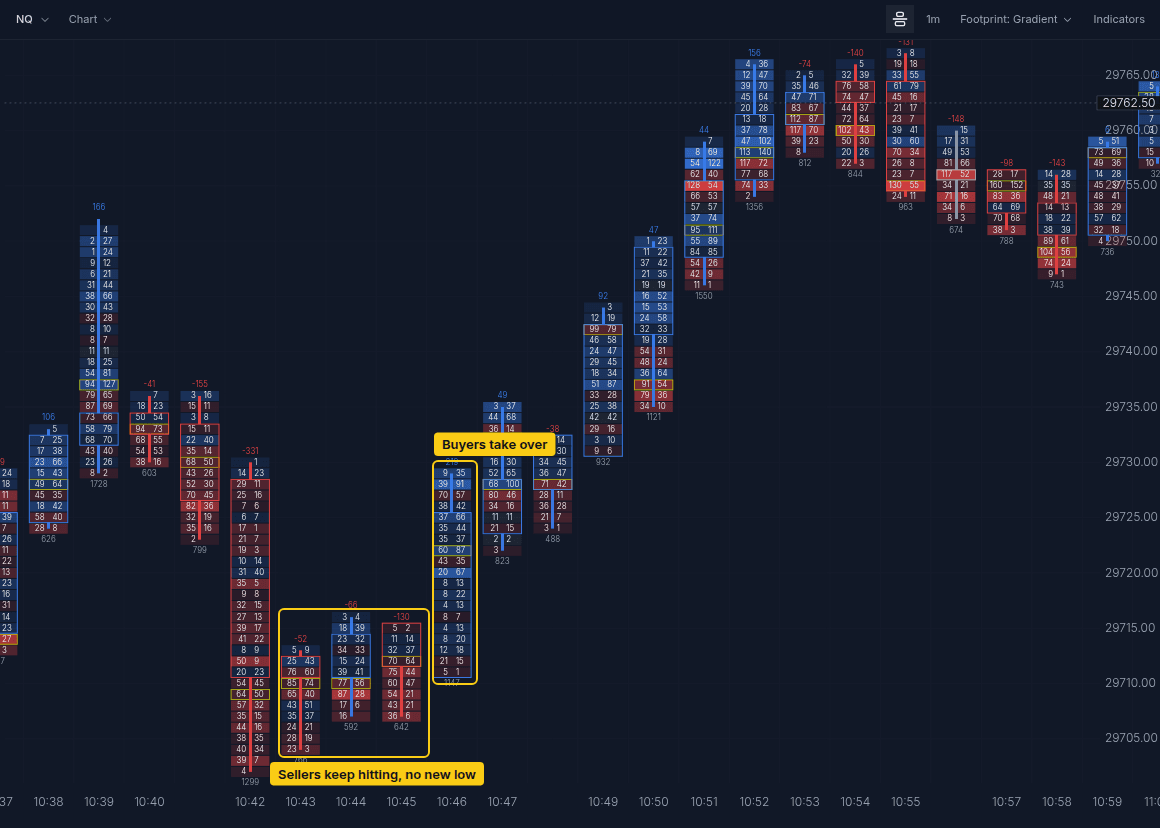
Replaying from 10:45, watch the bids just under price. Sellers keep hitting them and they keep filling back in, so the market orders never get through.
Replay this yourself from 10:40
Breakout
From 9:19 to 9:22 NQ holds under roughly 29,796. At 9:27 price flushes down to 29,745 and then reverses straight up, and the 9:28 bar opens right at the range high. By 9:31 price is at 29,845.
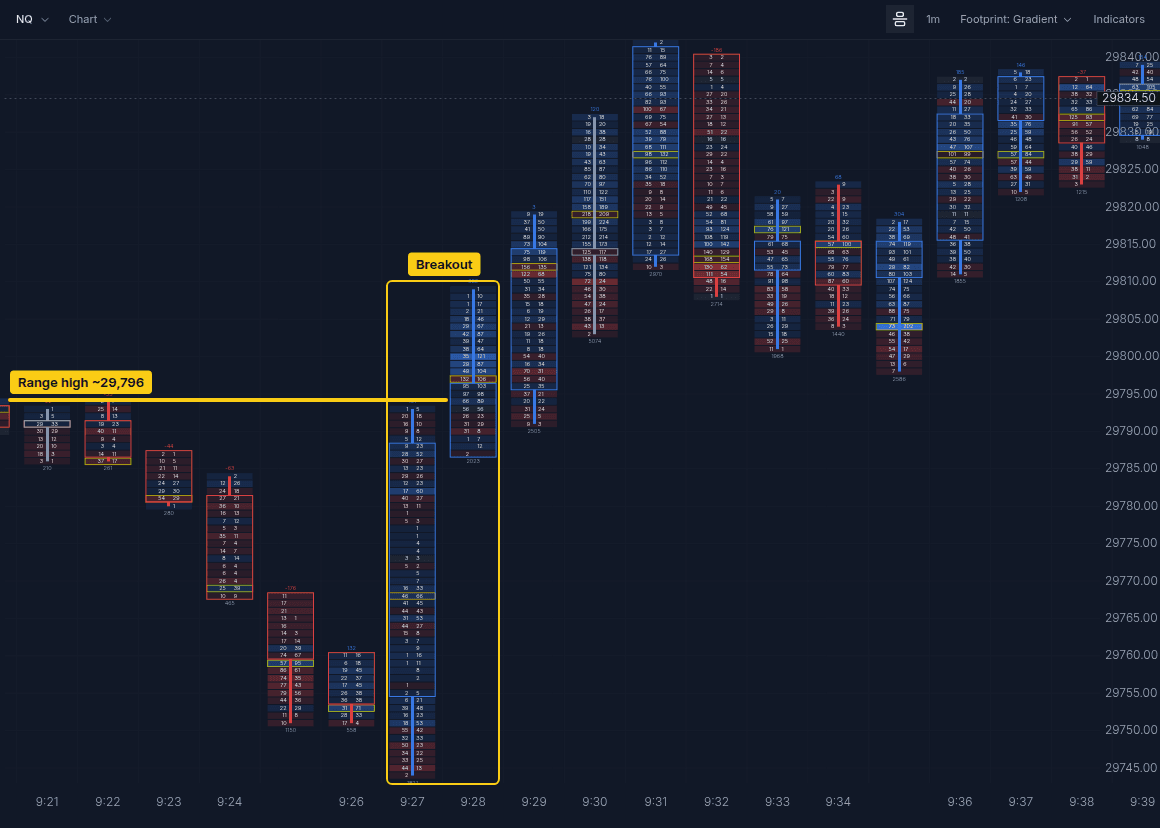
On the DOM the break is over almost instantly. The clip below is slowed to 0.1x: in the first fifth of a second of 9:28, buyers lift every offer from 29,788 up to about 29,798.
Replay this yourself from 9:20
Liquidity pull
At 10:01 price drops from about 29,783 to 29,751 on a delta of -325, and 10:02 carries it down to 29,729 on -381 with 2,339 contracts traded, the busiest bar of the morning.
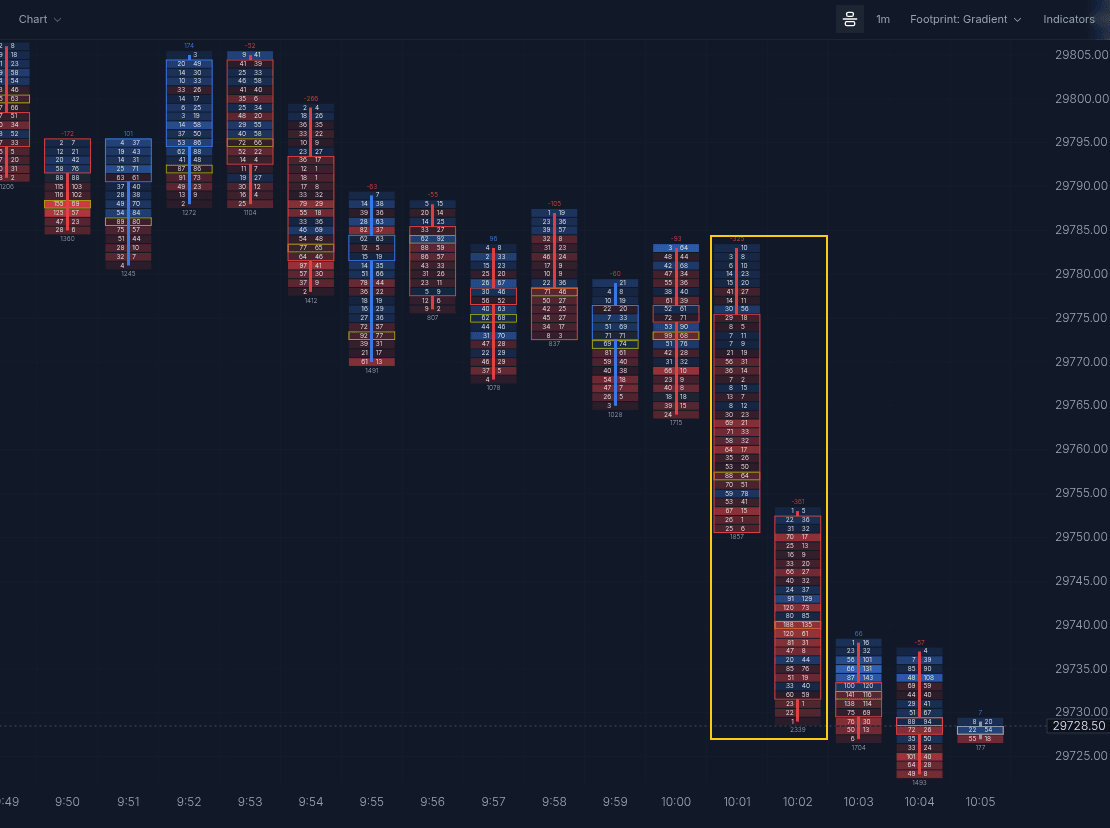
Replay from 10:01 and keep your eye on the bids under price rather than the prints. When buyers pull their limit orders, the size on the bid disappears before the selling arrives, and price falls through levels that looked supported a second earlier.
Replay this yourself from 10:00