Heatmap
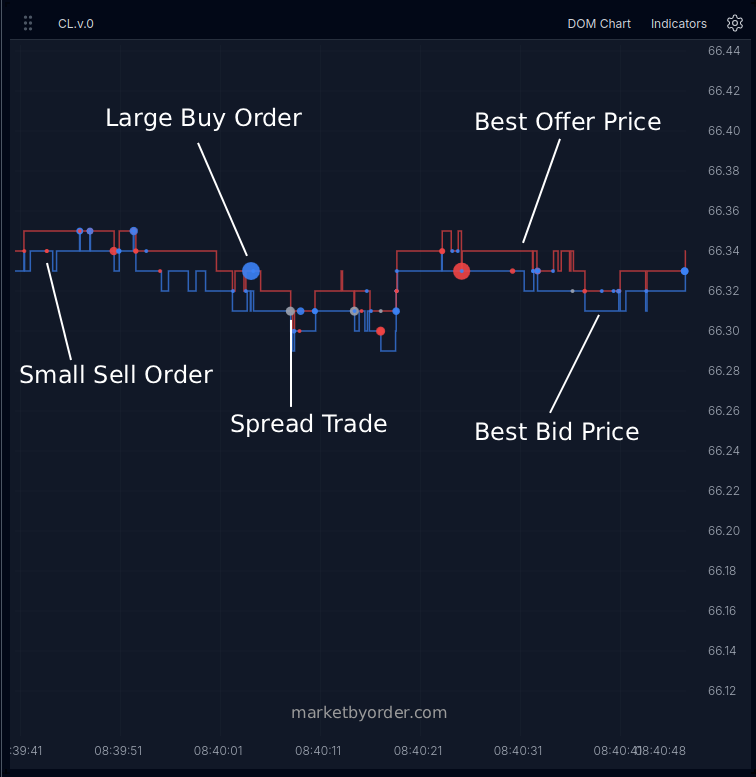
A Depth of Market Chart, is a chart that displays the position of the best bid (blue line) and best offer (red line). Also commonly included are trades represented as circles, blue - buys, red - sells; the larger the circle, the larger the quantity of trade.
Most software providers call these under various names like QuantTower's DOM Heatmap, or Bookmap's DOM Surface. They effectively show the same core information.