Code example
Periodic Volume Profile
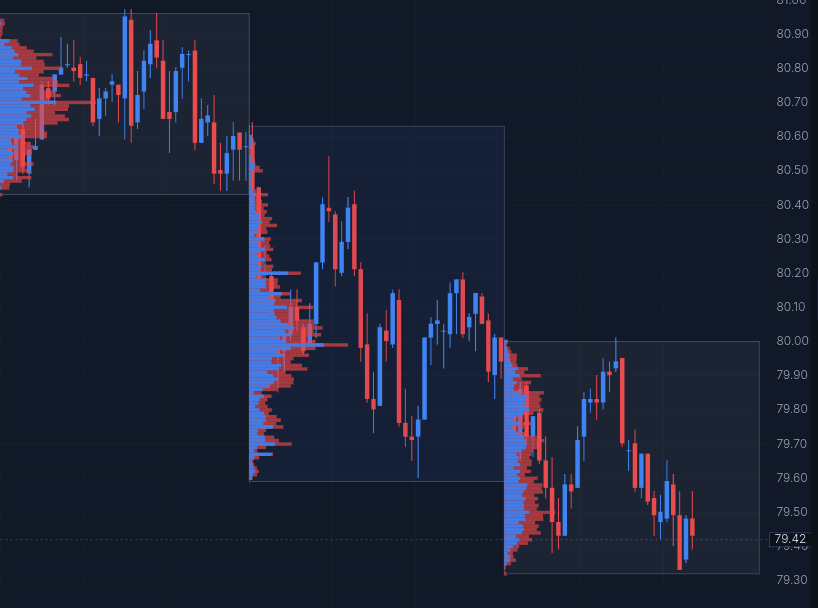
Build a periodic volume profile as a chart indicator. This example:
- Splits the chart into 40-candle blocks with
candles.slice()- candles are the unit, so the same code is correct on time intervals and tick intervals alike. - Builds a Volume Profile for each block with
volumeByPrice(). - Finds the highest traded volume across all blocks.
- Draws each profile normalized to that value.
- Renders a box showing the price range for each block.
// Periodic range boxes: 40-candle blocks, each with a high/low box and
// a left-adjusted volume profile whose width is a % of the block.

const BLOCK_CANDLES = 40
const PROFILE_PCT = 0.4   // longest profile bar = 40% of the block width

// First pass: one profile per block of candles, tracking the global max
// per-price total so bar widths are comparable between blocks
// (a bar's length reflects volume relative to the busiest level anywhere).
const blocks: {
  first: (typeof candles)[number]
  last: (typeof candles)[number]
  even: boolean
  profile: { price: number; buys: number; sells: number }[]
}[] = []
let maxTotal = 0

for (let i = 0; i < candles.length; i += BLOCK_CANDLES) {
  const block = candles.slice(i, i + BLOCK_CANDLES)
  const profile = volumeByPrice(block)
  if (profile.length === 0) continue

  for (const row of profile) {
    maxTotal = Math.max(maxTotal, row.buys + row.sells)
  }
  blocks.push({
    first: block[0],
    last: block[block.length - 1],
    even: (i / BLOCK_CANDLES) % 2 === 0,
    profile,
  })
}

// Second pass: draw boxes and profiles normalized to the global max total.
if (maxTotal > 0) {
  for (const { first, last, even, profile } of blocks) {
    const spanMs = last.time + last.interval - first.time

    // profile is sorted by price ascending, so the block's range is its ends.
    const lo = profile[0].price
    const hi = profile[profile.length - 1].price
    if (hi > lo) {
      chart.box({
        time1: first.time,
        price1: hi,
        time2: last.time,
        price2: lo,
        color: even ? "rgba(59, 130, 246, 0.08)" : "rgba(148, 163, 184, 0.08)",
        borderColor: "rgba(148, 163, 184, 0.3)",
      })
    }

    // Left-adjusted profile: widthTime scales the bar to a % of the block,
    // relative to the global max total so blocks are directly comparable.
    for (const row of profile) {
      const total = row.buys + row.sells
      // onPress makes the bar clickable: pressing it shows the buys/sells behind its width.
      const onPress = { text: `Buys: ${row.buys}
Sells: ${row.sells}` }
      chart.horizontalBar({
        price: row.price,
        widthTime: (total / maxTotal) * PROFILE_PCT * spanMs,
        time: first.time,
        anchor: "time",
        align: "right",
        color: "rgba(239, 68, 68, 0.65)",
        onPress,
      })
      chart.horizontalBar({
        price: row.price,
        widthTime: (row.buys / maxTotal) * PROFILE_PCT * spanMs,
        time: first.time,
        anchor: "time",
        align: "right",
        color: "rgba(59, 130, 246, 0.9)",
        onPress,
      })
    }
  }
}
Each price level draws two bars with chart.horizontalBar: a red bar for total volume and a blue bar for buys on top of it. The onPress text reveals the buys and sells behind a bar's width when it is clicked. Since volumeByPrice() returns rows sorted by price, each block's high and low are simply the first and last row.
Result