Volume Profile
Volume profile shows where volume traded. Why does that matter? Areas of high volume are ‘sticky’. These are prices of consensus.
Imagine hundreds of people buy and sell concert tickets for $100, but almost nobody is willing to sell for $90 or buy for $110. The market has reached a consensus that the tickets are worth around $100.
If price moves away from areas of high volume, the movement of the price is likely to be more erratic. Less consensus.
Volume Profile Properties
- Point of Control (POC) - the price with the highest traded volume.
- Value Area - the range containing approximately 70% of the traded volume.
- Value Area High (VAH) - the upper boundary of the Value Area.
- Value Area Low (VAL) - the lower boundary of the Value Area.
Example Strategies
Trading a Reversion
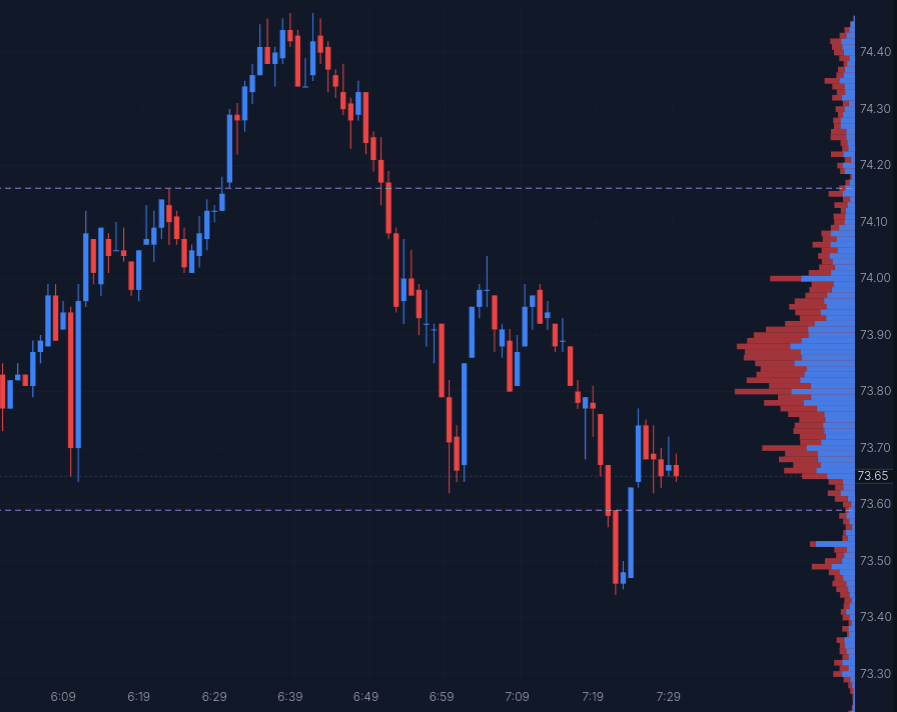
In the chart above, price briefly moves below the Value Area Low (VAL) before returning to the Value Area. This suggests the market rejected lower prices.
Some traders look for an opportunity to trade back toward the Point of Control (POC), where the highest amount of trading previously occurred. A common place to exit the trade is near the POC, while a move back below the VAL may invalidate the setup.
Trading a Breakout
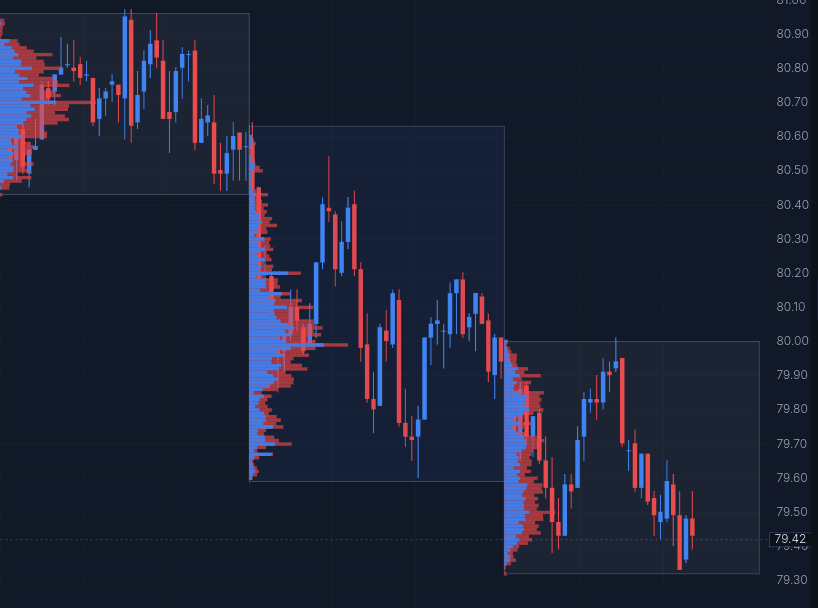
Unlike the previous example, price does not return to the previous Value Area. Instead, it establishes a new area of value at lower prices, shown by each session's Volume Profile shifting downward.
Some traders interpret this as a sign that the market is accepting lower prices. Rather than expecting a reversion toward the previous Point of Control, they look for opportunities to trade in the direction of the new trend.
Build your own Volume Profile
Volume Profiles can be customized to suit different trading styles. Check out this example to learn how to customize your own.