Code example
Iceberg Detection
Flag prices that absorbed more size than the book ever displayed there, as a chart indicator. This is the shipped Iceberg indicator. This example:
- Reads every trade with
tape.range()overtape.coverage(), resuming from a high-water mark so each run only scans trades it has not seen. - Pairs each trade with the book as it stood at that moment using
book.at(), skipping trades whose nearest snapshot is too old to trust. - Sums the size filled at each price against the size the snapshot displayed there: the excess is hidden liquidity.
- Draws an icon with
chart.text(), sized by how much size was hidden and flipped to show which side was hiding it.
// Iceberg - marks prices that traded more size than the book displayed there.

const MIN_HIDDEN = { ES: 14, NQ: 5 }[symbol.split(".")[0]] ?? 5
const MAX_BOOK_AGE_MS = 250   // book snapshots are ~200ms apart

const ICON = "🏔️"   // any emoji or short text
const ICON_MIN_SIZE = 12   // px, at MIN_HIDDEN
const ICON_MAX_SIZE = 30   // px, however large the iceberg

// Area, not height, tracks the hidden size: a 4x iceberg draws twice as tall.
const iconSize = (hidden: number) =>
  Math.min(ICON_MAX_SIZE, Math.round(ICON_MIN_SIZE * Math.sqrt(hidden / MIN_HIDDEN)))

type Detection = { time: number; price: number; hiddenBuyer: boolean; hidden: number }

// The loaded data changes when you jump the chart or reload the session, so
// detections are keyed to it and thrown away when it does.
const ranges = tape.coverage()
const epoch =
  ranges.length + ":" + (ranges[0]?.start ?? 0) + "|" + (book.coverage()[0]?.start ?? 0)
if (state.epoch !== epoch) {
  state.epoch = epoch
  state.scanned = 0
  state.detections = []
  state.snapTime = 0
}
const detections = state.detections as Detection[]

// Only trades past the high-water mark are scanned, so a run costs the new
// trades, not the whole tape.
const trades = ranges.length > 0 ? tape.range(ranges[0].start, ranges[ranges.length - 1].end) : []
for (let i = state.scanned as number; i < trades.length; i++) {
  const trade = trades[i]
  if (trade.side === "none") continue

  const snap = book.at(trade.timestamp)
  if (!snap || trade.timestamp - snap.time > MAX_BOOK_AGE_MS) continue
  if (snap.time !== state.snapTime) {
    state.snapTime = snap.time
    state.askSizes = Object.fromEntries(snap.ask.map((level) => [level.price, level.size]))
    state.bidSizes = Object.fromEntries(snap.bid.map((level) => [level.price, level.size]))
    state.traded = {}
    state.marked = {}
  }

  // A buy lifts the ask, so the size it has to get through is the ask side.
  const displayedAt = (trade.side === "buy" ? state.askSizes : state.bidSizes) as Record<number, number>
  const traded = state.traded as Record<string, number>
  const marked = state.marked as Record<string, number>

  for (const fill of trade.levels) {
    // A price the snapshot never showed is unknown liquidity, not hidden size:
    // it may sit outside the book's ten levels, or the market may have moved
    // since the snapshot was taken.
    const displayed = displayedAt[fill.price] ?? 0
    if (displayed === 0) continue

    // Fills at one price accumulate against a single displayed size: an iceberg
    // is many small trades eating the same level, not one big one.
    const key = trade.side + "@" + fill.price
    const total = (traded[key] ?? 0) + fill.size
    traded[key] = total
    const hidden = total - displayed
    if (hidden < MIN_HIDDEN) continue

    const at = marked[key]
    if (at === undefined) {
      marked[key] = detections.length
      detections.push({ time: trade.timestamp, price: fill.price, hiddenBuyer: trade.side === "sell", hidden })
    } else {
      detections[at].hidden = hidden
    }
  }
}
state.scanned = trades.length

for (const d of detections) {
  chart.text({
    time: d.time,
    price: d.price,
    text: ICON,
    size: iconSize(d.hidden),
    rotate: d.hiddenBuyer ? 0 : 180,
  })
}
book.at() serves depth snapshots sampled roughly every 200ms, so a snapshot is only used while it is younger than MAX_BOOK_AGE_MS. Fills accumulate per price for as long as one snapshot stands, because an iceberg shows up as a stream of trades refilling the same level rather than one oversized print, and a detection already on the chart is updated in place as it grows rather than drawn twice. MIN_HIDDEN is per symbol: an excess of 5 contracts means something on NQ and nothing on ES.
Result
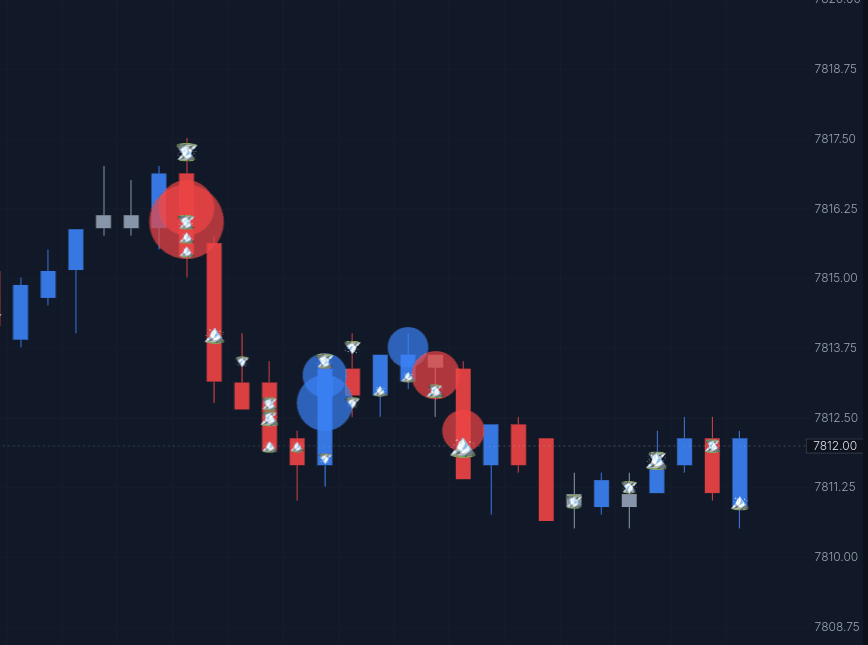
Each icon sits at the price that was worked. An upright icon is a hidden buyer: sellers kept hitting the bid and it kept refilling. An inverted icon is a hidden seller absorbing buyers at the ask. Icon area scales with the hidden size, so the biggest icons are the levels where the most size sat unseen.
Open this setup in the app - a chart running Iceberg and Big Trades next to the ladder. The link opens that setup without touching your own saved layout, and it survives signing up.