Depth Indicator
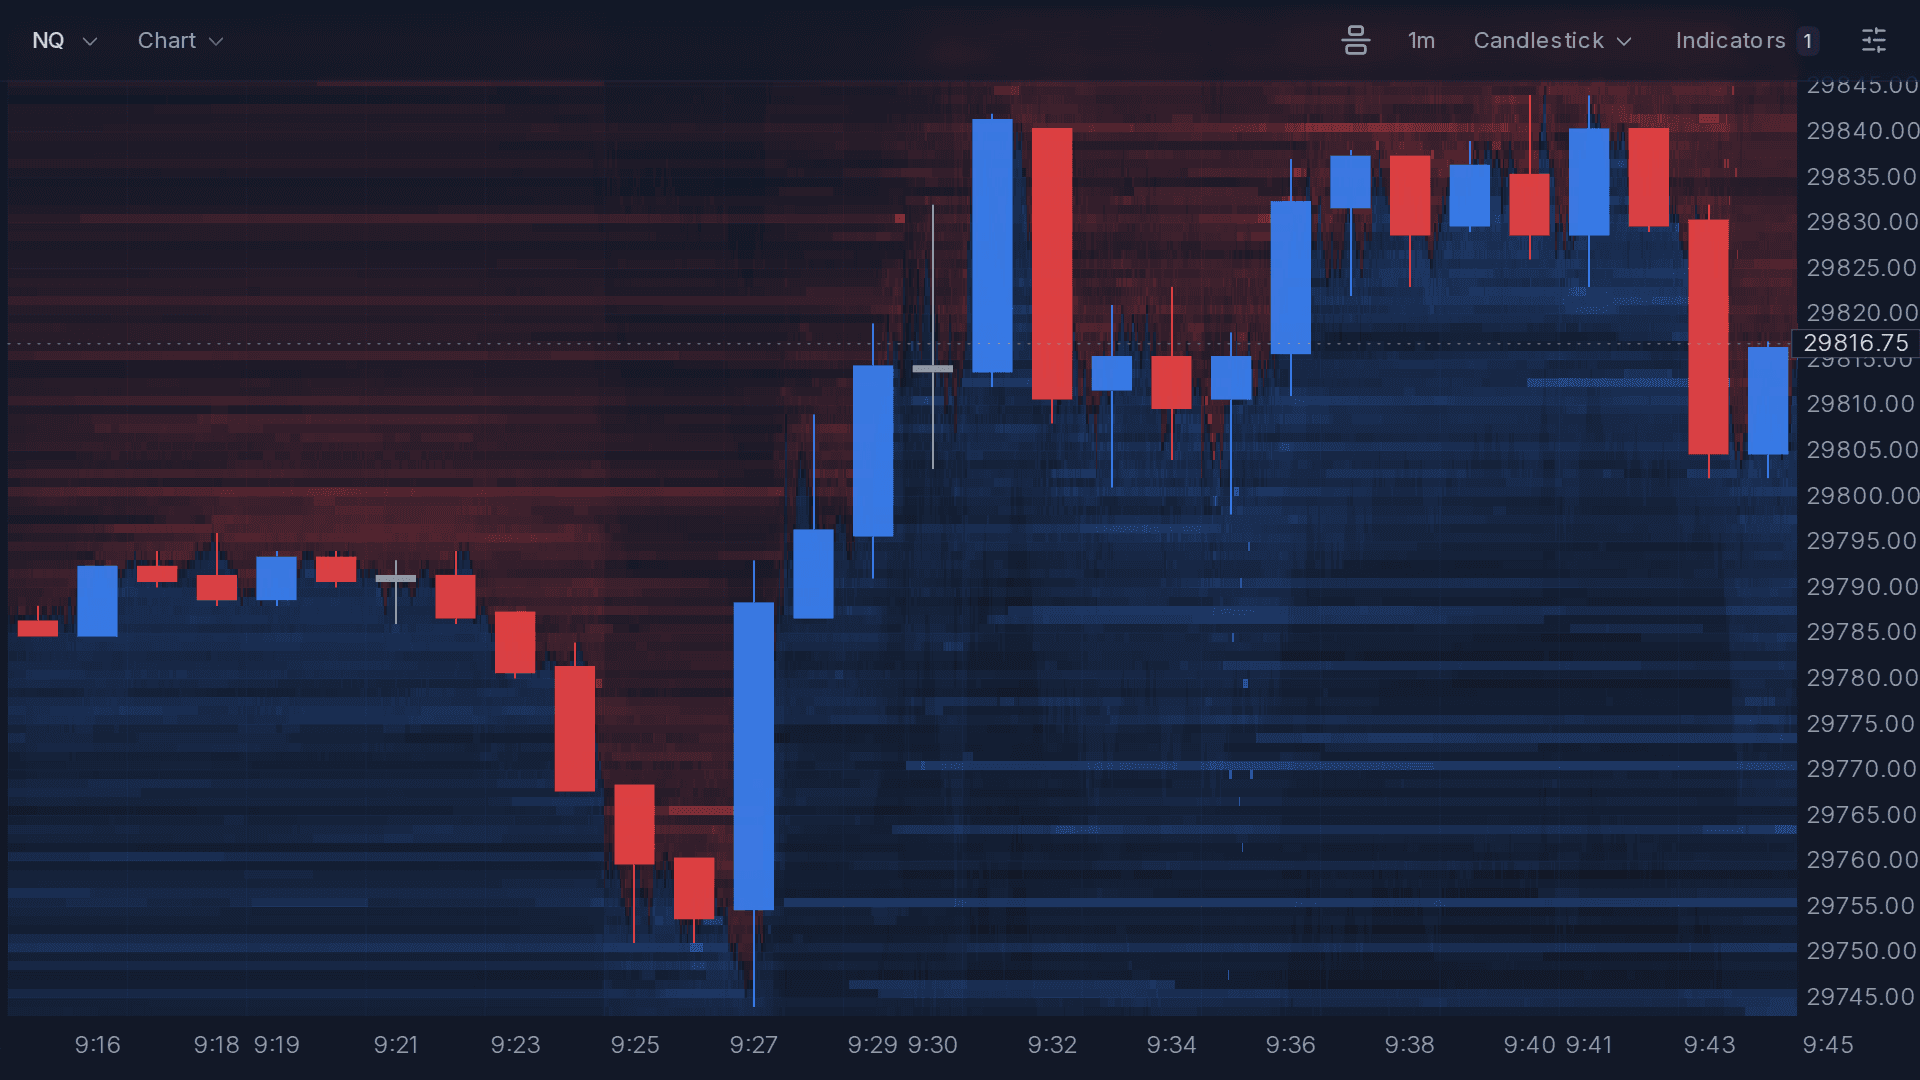
The Depth indicator paints the order book behind your candles: the resting bids and offers at each price, for every moment of the replay. It is the same book the DOM ladder shows, drawn across the chart so you can see where size was sitting before price got there, and whether it stayed.
Turning it on
- Open the Indicators panel from the chart's toolbar.
- Press Depth to add it to the chart. Press it again to take it off.
Depth works behind candlestick and footprint charts on time intervals, such as 1 minute or 5 minutes. It draws nothing on tick or range bars. If you want the book on its own, pick Heatmap from the chart style menu instead: it draws the same book with the best bid and offer as lines and large trades as markers. The heatmap post walks through three sessions in that style.
How to read it
- Blue below price is resting bids, buyers waiting to be hit. Red above price is resting offers, sellers waiting to be lifted.
- Brighter means more size resting at that price. A row reaches full brightness at the size in the table below.
- A band that runs left to right is size that stayed in the book. Where a band stops, those orders were pulled or traded.
- On a condensed chart, each row adds up the ticks it covers, the same way the footprint adds up volume.
| Instrument | Contracts at full brightness |
|---|---|
| ES | 150 |
| NQ | 50 |
| Every other instrument | 50 |
What to watch for
- Size pulled as price arrives. A bright row that fades just before price reaches it was never going to be filled.
- Size that holds while it trades. Price runs into a bright row, trades there, and the row stays bright. The resting side is refilling, which is absorption.
- Dark stretches. Little resting size means a market order moves price further. See liquidity for why a thin book slips.
- Which rows got hit. Add Big Trades as well to see the large orders that traded into a bright row.
Replay the NQ open on September 18, 2026 and turn on Depth to watch the book build into the 9:30 ET open.
Changing the colours
Depth is a script. Open it in the Indicators panel and press Duplicate to edit your own copy. The whole script is one setting:
chart.depth = {
  opacity: 1,
  bid: 'rgba(59, 130, 246, 0.48)',
  ask: 'rgba(239, 68, 68, 0.48)',
  max: 0,      // resting size at full brightness · 0 keeps the instrument's own
  curve: 1,    // 1 linear · below 1 lifts ordinary levels · above 1 only the biggest
}
max is the resting size that paints at full brightness, so raising it keeps ordinary rows quiet and lets only the biggest stand out. curve bends the ramp in between. Every option is listed under chart.depth.
Questions
What does the Depth indicator show?
The resting limit orders at every price over time, painted behind the candles. Blue is bids below price, red is offers above it, and a brighter row means more size was resting there.
What is the difference between Depth and the DOM?
The DOM ladder shows the order book as it is right now. Depth draws the history of that same book across the chart, so you can see where size sat before price arrived and whether it was still there when price did.
Why does Depth draw nothing on my chart?
Depth needs a time interval such as 1 minute or 5 minutes. On tick and range bars the chart is not laid out by clock time, so there is nowhere to place each moment of the book.
Is the Depth indicator free?
Yes. Every indicator is included with a free account, which gets 5 minutes of replay time daily across up to 3 replays. Pro removes the daily limit.
Further Reading
To place orders against the book, see the DOM docs. To put Depth behind a footprint, see the Footprint docs. To trade against the replayed book, see sim trading with order flow.