Historical Heatmap: Replay the Order Book on Any Past Session
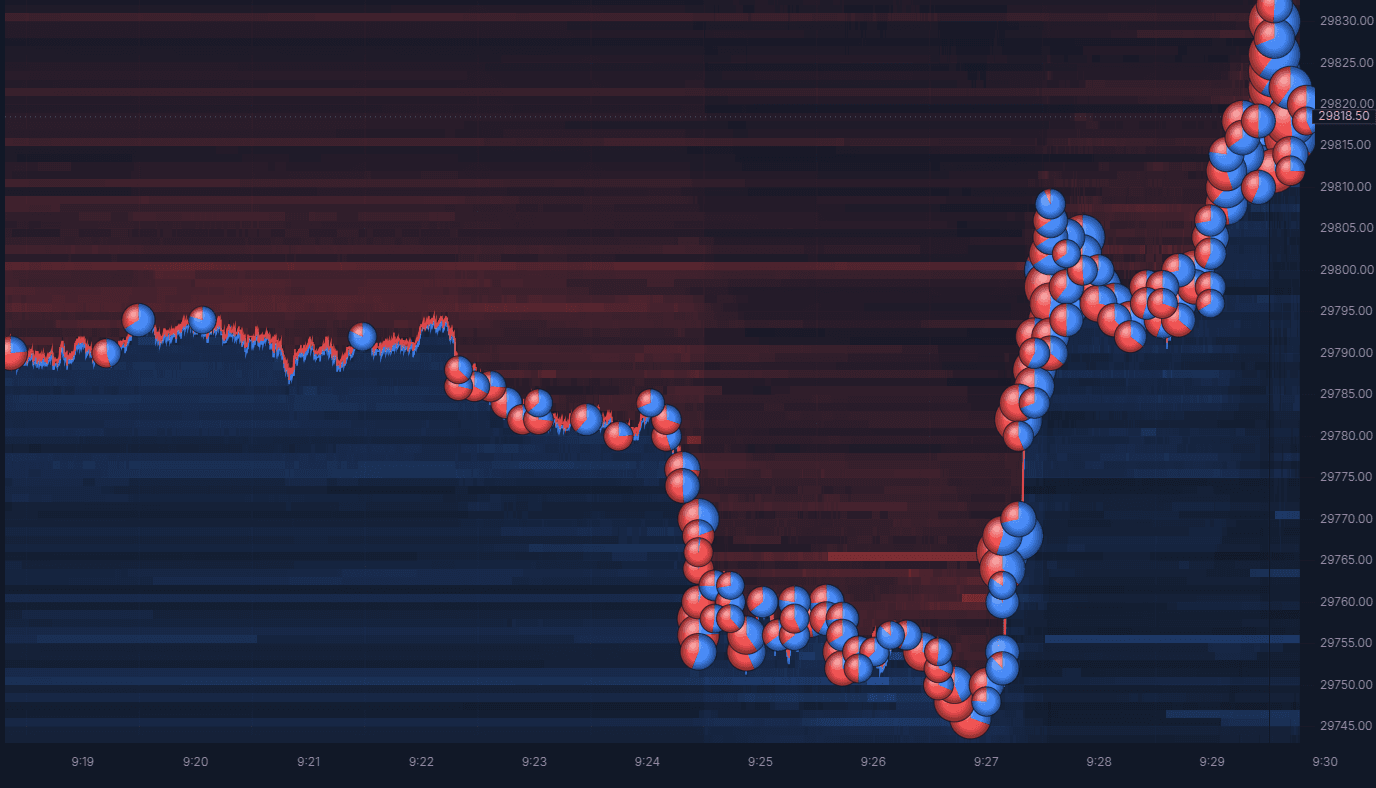
An order book heatmap shows how much size is resting at every price, over time. Price runs up the side, time runs across, and the brighter a spot, the more limit orders were sitting there. On MarketByOrder you pick a day that has already traded and the heatmap replays from that minute: orders appear, get pulled, and get traded through in the same order they did live.
Open a past day
- Under Session date, click the date and pick a day from the calendar. Greyed out days have no data. Latest day and Random day are one click shortcuts.
- Set the Time. RTH open jumps to 9:30 ET and RTH close to 16:00 ET.
- Pick the Primary instrument, for example ES or NQ.
- Click Open session.
- In the chart header, open the chart style menu and choose Heatmap or Heatmap: Bookmap Circles.
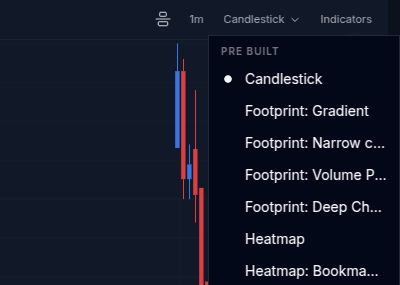
Heatmap draws the book with the best bid and offer as lines on top and large trades as markers. Heatmap: Bookmap Circles groups trades into circles sized by volume, each split into its blue buys and red sells, so you can see which orders on the heatmap got hit.
To put the heatmap behind a footprint chart instead, keep your footprint style and turn on Depth in the Indicators panel. The heatmap works on time bars, not tick bars.
What to watch for
- Orders pulled before price gets there. A bright level that fades out as price approaches was never going to be filled.
- Orders that hold. A level that stays bright while trades print into it is being absorbed. If it refills after each hit, someone is reloading it.
- Thin books. A dark stretch above or below price is where it can move quickly, because there is little resting size in the way.
These are easier to judge in a replay than on a finished chart, because you see the order the changes came in. Stacking, pulling and absorption shows the same moves on the DOM ladder, which replays alongside the heatmap.
Move around the day
Play at speeds from 0.01× to 16×, and pause whenever something catches your eye. To jump somewhere else, right click the chart and pick Replay from here, or Skip to here if that minute has not loaded yet. Clicking the time in the header opens Select Date & Time for a completely different day.
Which markets, and how much of the book
The included data covers these futures, from August 2025 onward:
ES, MES, NQ, MNQ, YM, MYM, RTY, M2K, CL, NG, GC, MGC, SI, ZN, 6E, M6E, BTC, plus FDAX on Eurex.
It carries the best 10 prices on each side of the book, which covers the part of the book that price is about to trade into. CME days become available about eight hours after they trade, and every symbol is a continuous contract that rolls from one front month to the next.
For the full order book, older dates, or specific contract months, connect your own Databento key in your account. You pay Databento directly for the data a replay uses.
Days worth replaying
Scheduled news shows the book at its most interesting: it thins out in the minutes before the release and refills after. These links open straight into the replay, ten minutes before the event.
ES, FOMC decision, September 16, 2026
The rate decision comes out at 14:00 ET. Watch how much of the book is still there in the last minute before it, and how quickly it comes back once the first move is done.
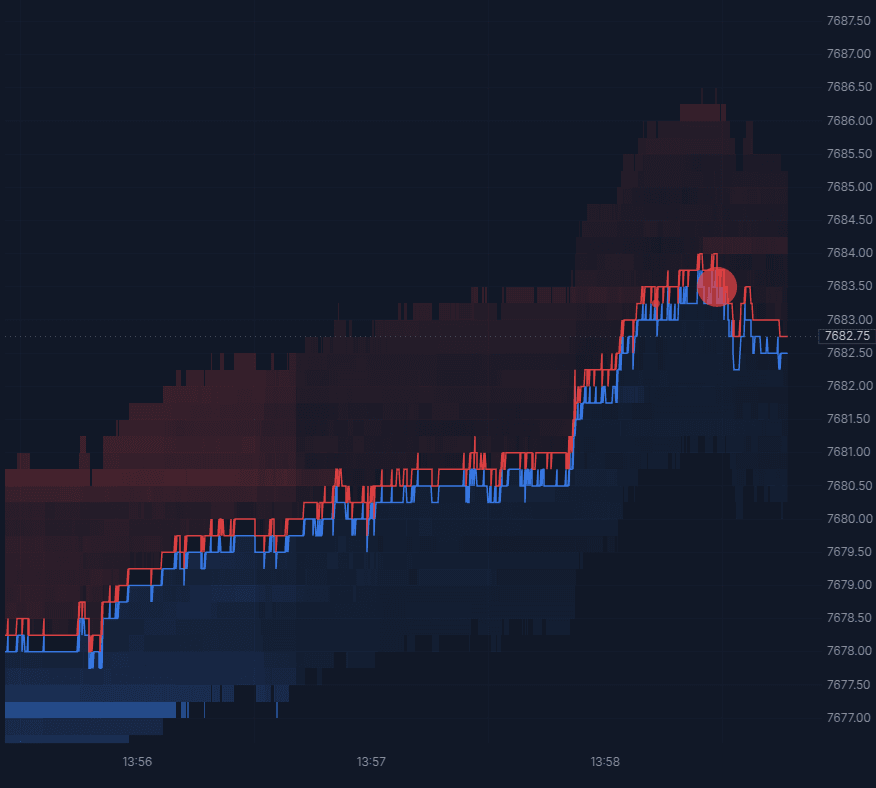
CL, crude inventory report, September 16, 2026
The weekly EIA crude inventory report is out every Wednesday at 10:30 ET. Compare the size resting either side of price just before 10:30 with how far the first second of the release travels.
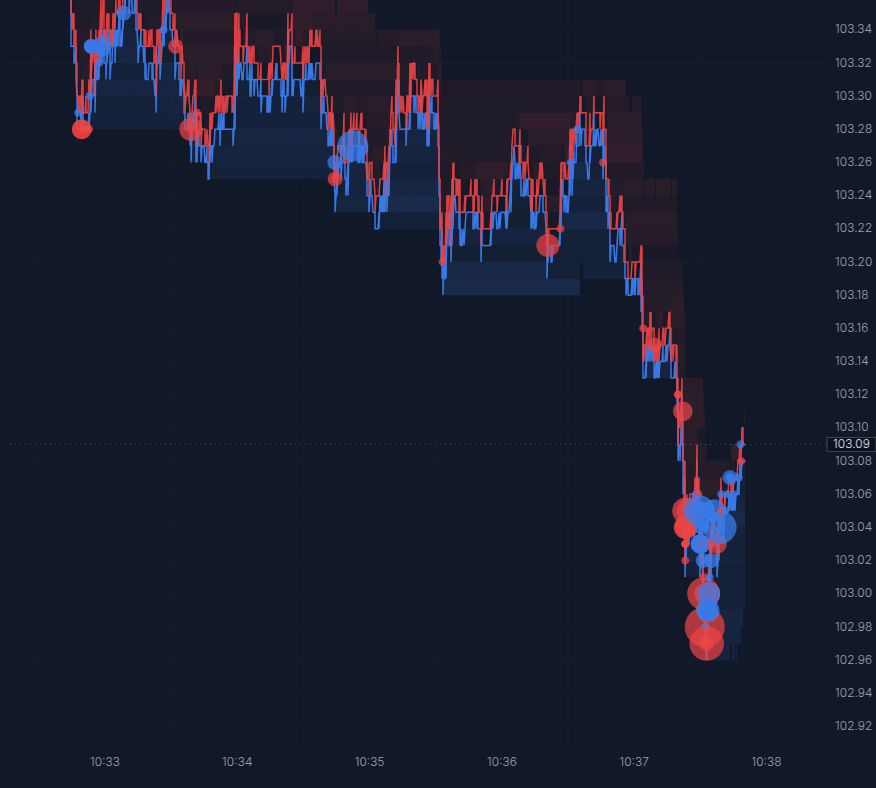
NQ, the cash open, September 18, 2026
The 9:30 open is the busiest stretch of most days. Slow the replay down to 0.1× for the first minute, since the book changes too quickly to follow at full speed.
Pricing
Every account gets 3 replays and 5 minutes of replay time a day for free, on all of the markets above. A paid plan removes the limit. Create an account to open your first session.
To change the heatmap's colours and brightness, see chart.depth. To read the book from your own indicator, see the book docs. For the footprint side of the same replay, see Historical Footprint Charts.