ICT to Order Flow: Testing the Opening Range FVG Setup on NQ
By Geoff ·
ICT setups are drawn from candles: a range, a break, a gap. Order flow shows what traded inside those candles, who was the aggressor and how much. This post takes one popular ICT setup, tests it on a year of NQ, and then looks at the same trades on the footprint to see whether delta tells the good ones from the bad ones.
The setup
The rules come from a widely upvoted Reddit post, a trader's NQ opening range strategy:
- Mark the high and low of the first 15 minutes after the 9:30 ET open.
- Wait for a 1-minute candle to close outside the range, not just wick through it.
- Enter on a 1-minute fair value gap (FVG) in the direction of the break.
- Put the stop at the first candle of the gap.
- Take 1R, or 2R when the stop is under 30 NQ points.
A bullish fair value gap is three candles where the third candle's low is above the first candle's high. The middle candle, the displacement, traded through prices that the candles either side never touched. A bearish one is the same upside down.
How we tested it
We replayed every NQ trade from 9:30 to 12:00 ET on 214 sessions, January 2 to October 30, 2026, from the MarketByOrder archive. Each session took at most one trade: the first 1-minute close outside the 15-minute range before 11:00 ET, then the first FVG in that direction within 10 minutes. Exits were checked trade by trade on the tape, so a minute that touched both the stop and the target counts whichever came first. Stops fill at the stop price and there are no commissions, so real results would be slightly worse.
The Reddit post calls the FVG the entry trigger, which can mean two things, so we tested both: entering at the close of the third candle, and a limit order at the near edge of the gap, filled if price came back to it within 30 minutes. 3 sessions never closed outside the range by 11:00 and 40 had no gap within 10 minutes of the break, which leaves 171 setups.
The original trader also weighs higher-timeframe bias and sits out choppy weeks. Those calls are not in a mechanical test, so this measures the rules, not the trader.
The setup on its own lost
| Entry | Trades | Wins | Profit factor | Total |
|---|---|---|---|---|
| At the close of the third FVG candle | 171 | 43.9% | 0.83 | -16.0R |
| Limit order at the edge of the gap | 148 | 40.5% | 0.85 | -13.4R |
A profit factor under 1 means the losses outweighed the wins. Longs and shorts lost about equally: 95 longs won 43.2% and 76 shorts won 44.7% with the close entry.
The stop was wider than the post's 30-point line most of the time. With the close entry the first candle of the gap put it a median 55 points away, and half of all stops sat between 40 and 71 points, so the 2R target applied to only 23 of the 171 trades. The limit entry is closer to the gap, a median 36.5 points, and used 2R on 51 of its 148. In both cases the 2R trades did worse than the 1R ones: 17% and 27.5% wins.
The trades were short. The median close entry was over in 8 minutes and the median limit entry in 4, the same under-10-minute trades the post singles out as its best group.
What delta added
The obvious order flow check is whether delta, buys minus sells, agrees with the break. It nearly always does. The displacement candle had delta in the direction of the trade on 167 of 171 setups, and the breakout candle on 164. A candle big enough to leave a gap is almost always pushed by aggressive orders in its direction, so "delta confirms the FVG" filters out next to nothing.
What did separate the trades was how one-sided the displacement candle was. Delta share is the candle's delta as a share of its volume, the two numbers Candle Delta writes above and below each candle: delta +600 on 3,000 contracts is a delta share of 20%. The median was 14%. The most one-sided third of displacement candles, 17% or more, did clearly worse:
| Delta share | Close entry trades | Wins | Limit entry trades | Wins |
|---|---|---|---|---|
| 17% or more | 57 | 33.3% | 51 | 31.4% |
| Under 17% | 114 | 49.1% | 97 | 45.4% |
It held in both halves of the year. With the close entry the one-sided third won 33.3% from January to May and 33.3% again from June to October, while the rest won 48.2% and 50.0%. The gap that looks strongest on the candles, a large candle driven almost entirely by aggressive orders one way, was the one most likely to give the move straight back.
Taking the trade against the session's cumulative delta since 9:30 also did worse, 36% wins over 28 trades against 45.5% over 143, but that is too few trades to lean on. We also measured how hard the other side traded as price came back to the gap. It pointed one way from January to May and the other from June to October, so it is not in the results.
Leaving out the one-sided third does not make the setup profitable. The remaining trades come out about even: a profit factor of 1.00 with the close entry and 0.92 with the limit. Delta tells you which gaps to distrust, not that the rest will pay.
One that worked: October 12
NQ's opening range on October 12, 2026 ran from 30,936 to 31,048.75. At 10:06 ET a 1-minute candle closed at 30,921, below the range, and the next candle left a bearish gap between 30,933 and 30,922.75. The displacement candle had delta of -119 over 1,931 contracts, a delta share of 6%: sellers in control but nowhere near one-sided.
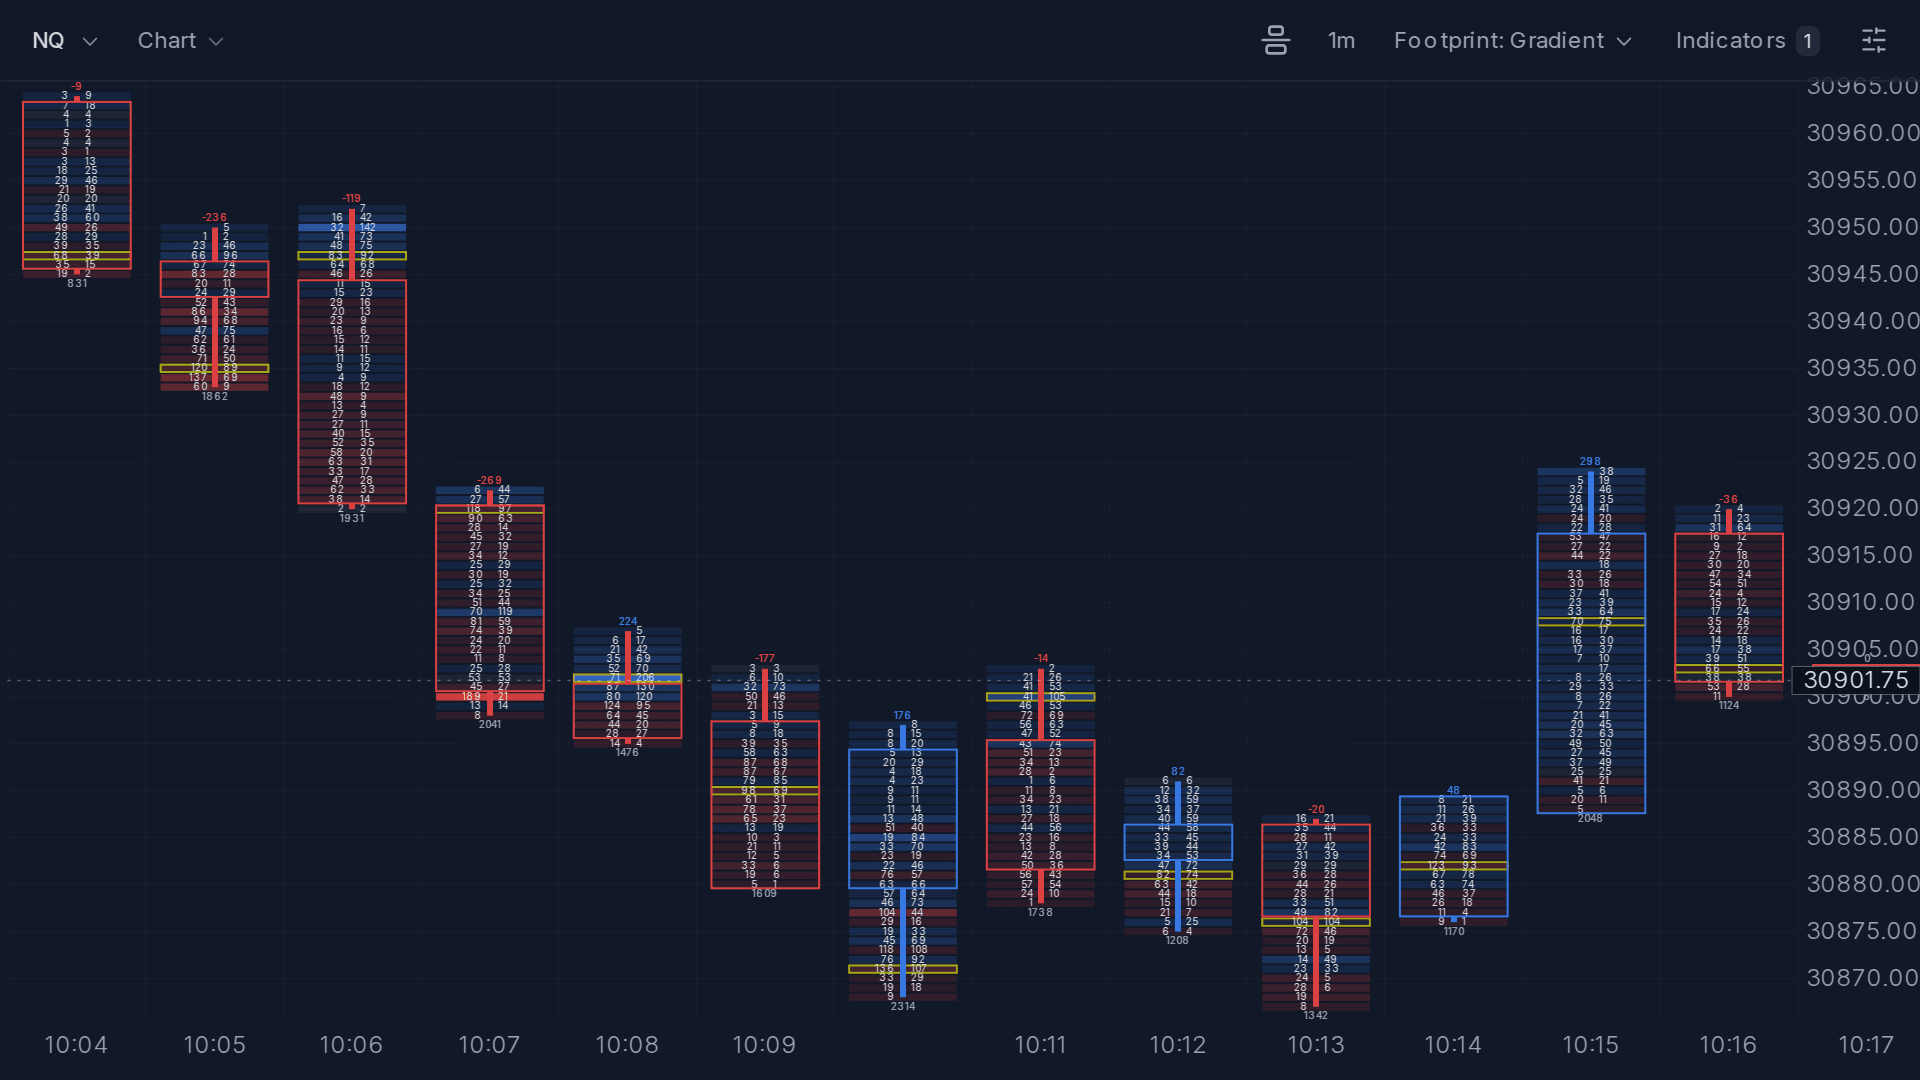
The close entry, short at 30,901.50 with the stop at 30,950, never reached its 1R target and was stopped later in the morning. The limit entry waited for price to come back up into the gap at 10:15, filled at 30,922.75 with a 27.25-point stop, and reached its 2R target at 30,868.25 by 10:26. Same gap, same day: the entry decided the result.
Replay NQ from 10:00 ET on October 12, 2026.
One that failed: October 14
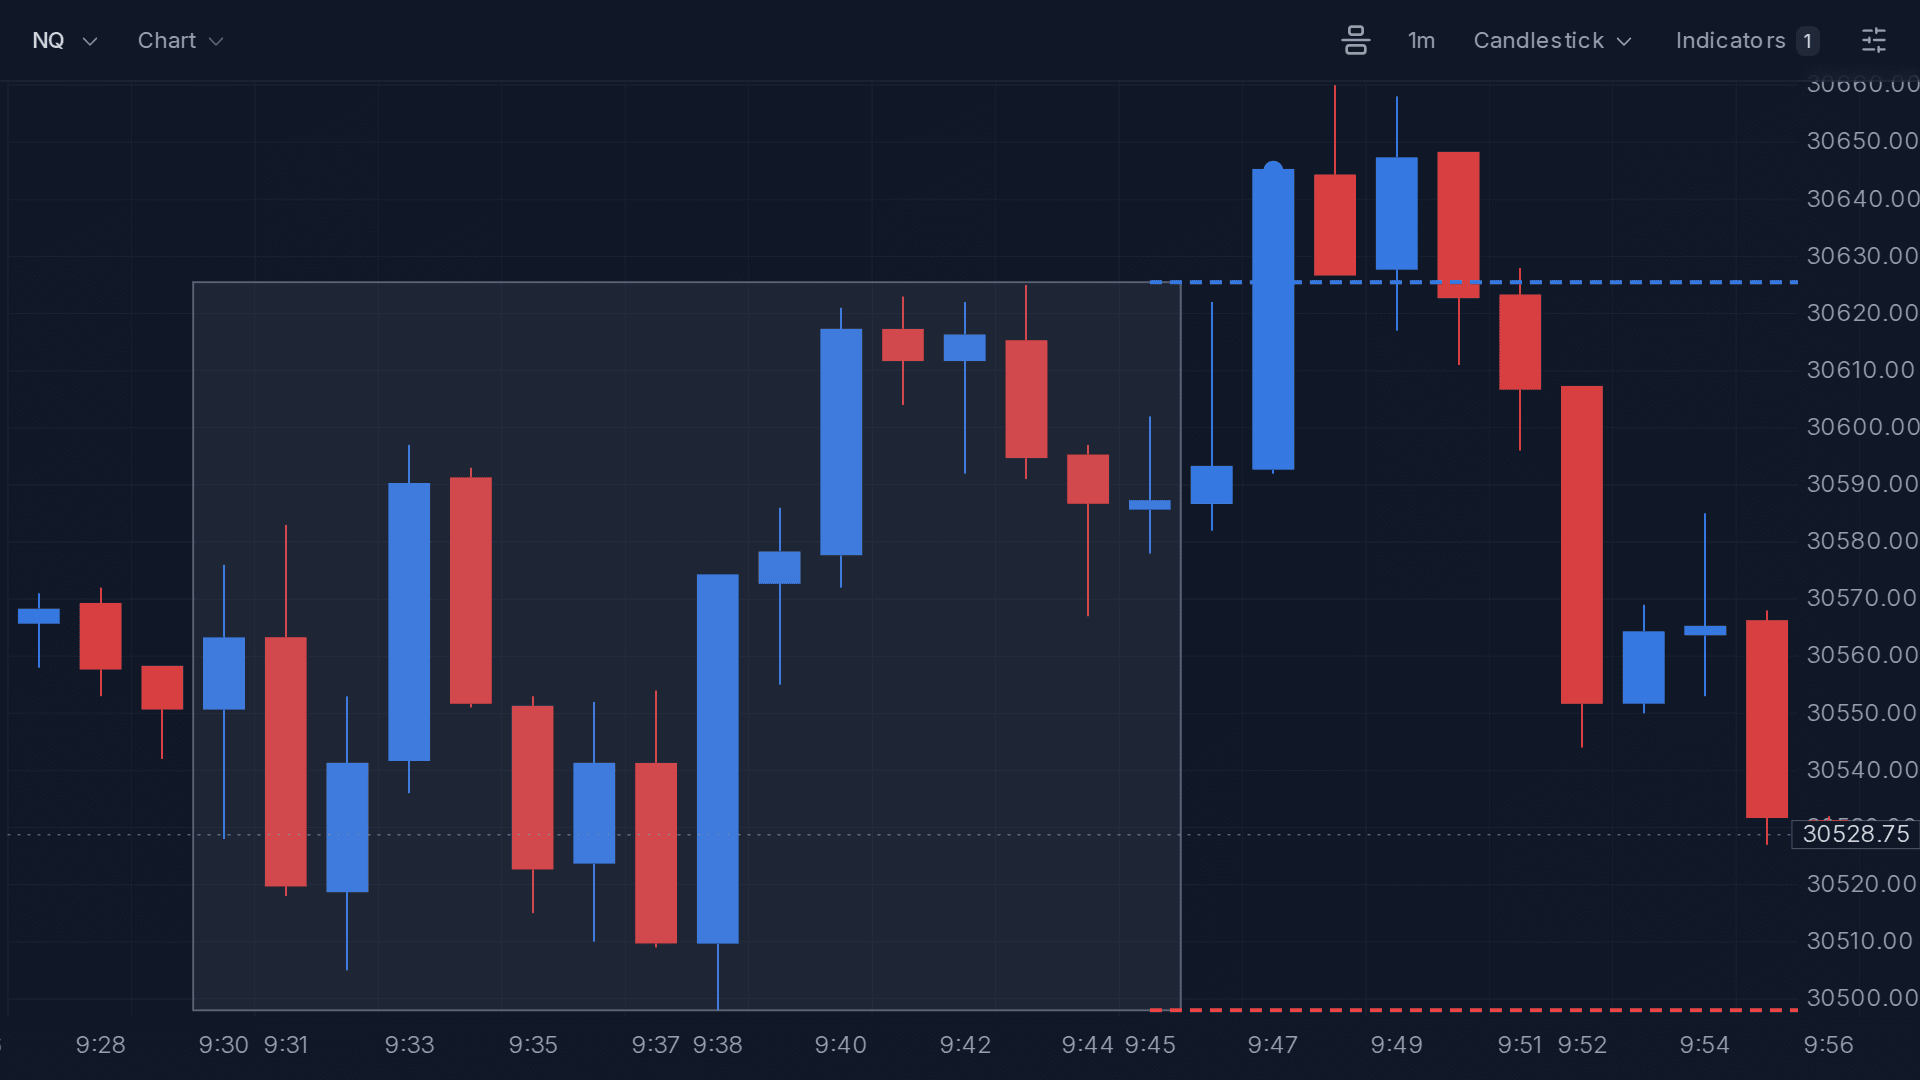
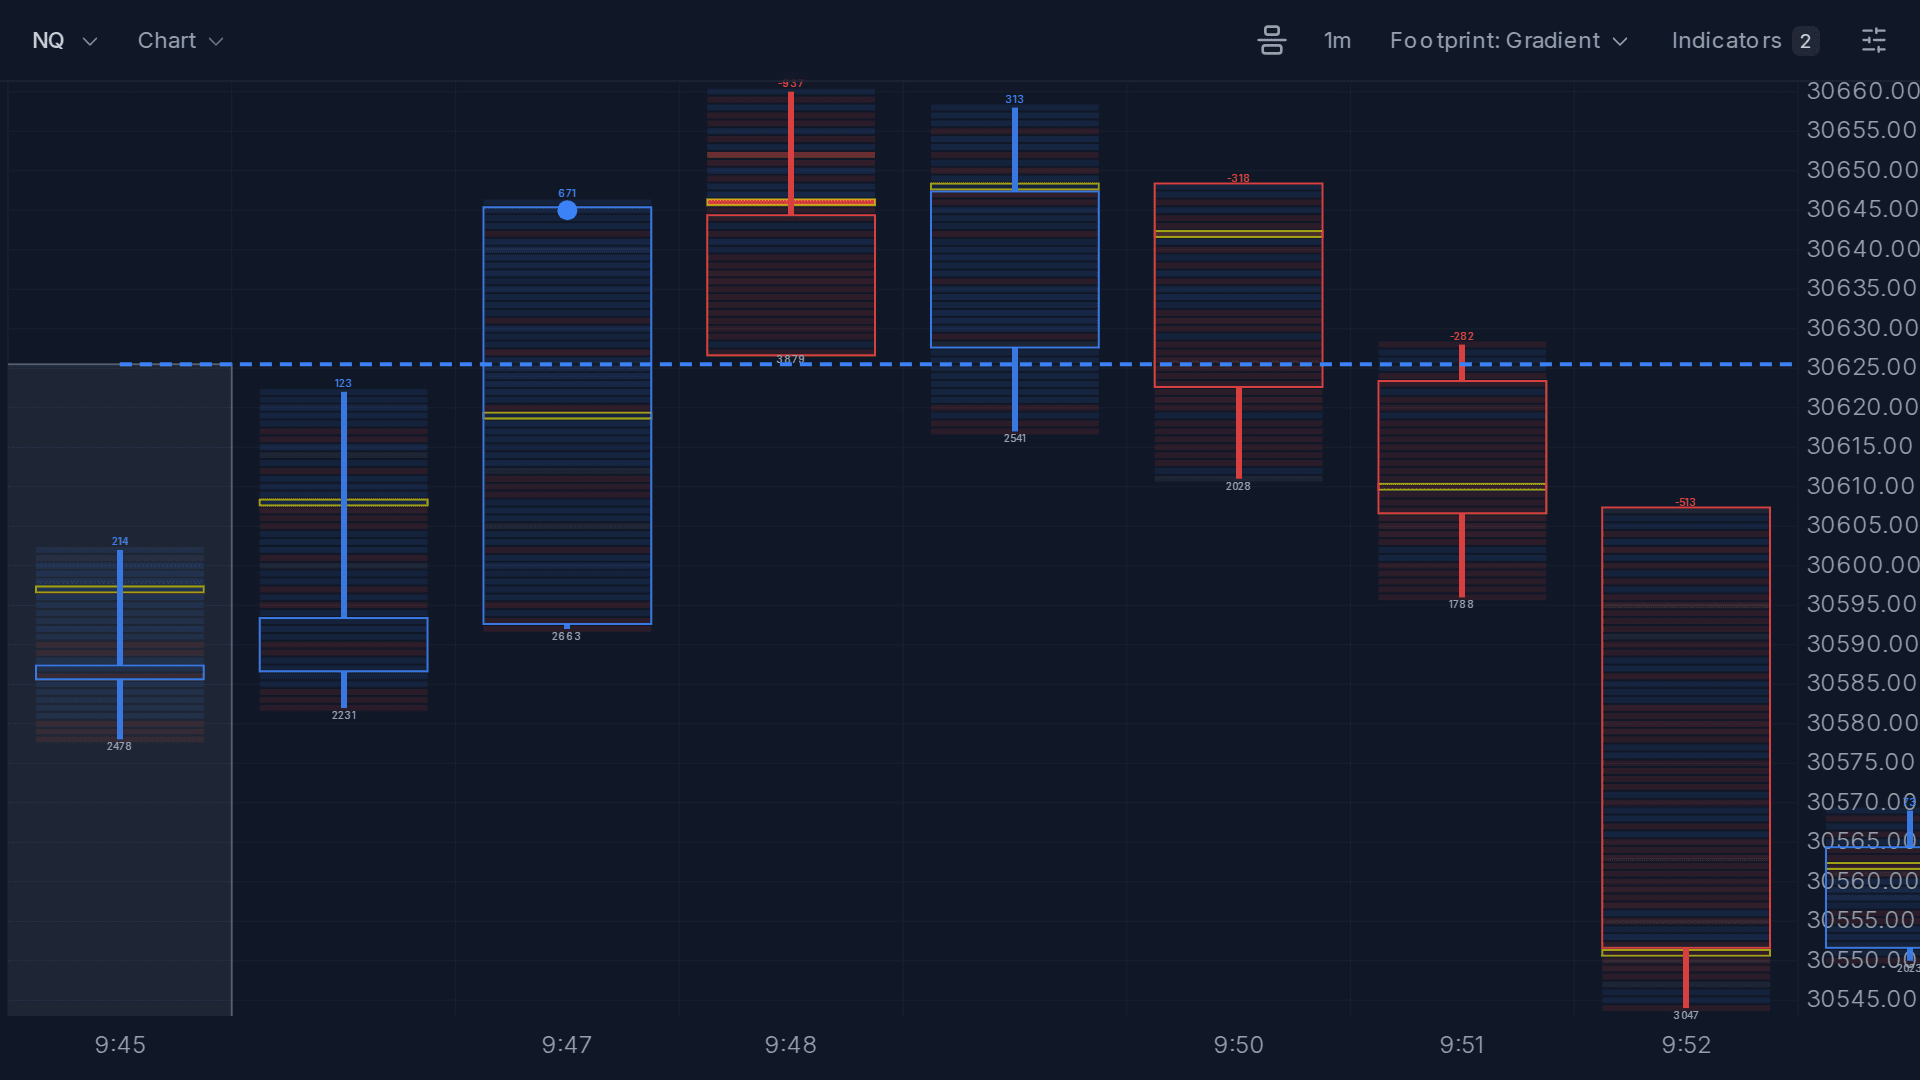
The range on October 14 ran from 30,498 to 30,625.50. At 9:47 ET a candle closed at 30,645, above the range, with delta of +671 over 2,663 contracts, a delta share of 25%, in the one-sided third. The next candle left a 4.5-point bullish gap between 30,622.50 and 30,627. On candles it is the setup as described: a clean range, a close outside it, a gap.
The footprint shows the next candle differently. It had delta of -937 over 3,879 contracts: sellers hit straight into the buying that had just made the gap. Both entries went long at about 30,627 with the stop at 30,582.75, and both were stopped at 9:52 as NQ fell to 30,544.25.
Replay NQ from 9:45 ET on October 14, 2026.
Practice it on the footprint
- Open an NQ replay a few minutes before 9:30 ET, or any date listed for NQ on the instruments page.
- Click Indicators above the chart, pick Opening Range Breakout, click Duplicate to edit, and change the range to 15 minutes. It ships at 30:
Then click Apply.const RANGE_MINUTES = 15 // 5 · 15 · 30 · 60 - Turn on Candle Delta from the same list. It writes each candle's delta above it and its volume below, so the delta share of a displacement candle is the top number divided by the bottom one.
- Switch to the footprint chart to see the gap's prices row by row, and the DOM to watch the limit order wait at the edge of the gap.
- Place Sim orders with PT and SL in ticks. An NQ tick is 0.25 points, so a 30-point stop is 120 ticks.
An account is required to start a replay, and a free account plays 5 minutes of replay a day. For more on reading the aggressive side, see absorption and how to read the DOM.
Questions
Does the ICT opening range FVG setup work on NQ?
Traded mechanically, it lost on NQ in 2026. Across 214 sessions from January 2 to October 30, the 15-minute opening range breakout with a 1-minute fair value gap gave 171 trades. Entering at the close of the gap's third candle won 43.9% with a profit factor of 0.83. A limit order at the edge of the gap filled 148 times, won 40.5%, and had a profit factor of 0.85. Both are before commissions.
Does delta confirm a fair value gap?
Almost always, so it tells you little. The middle candle of the gap, the one that moves price through it, had delta in the direction of the trade on 167 of 171 setups. What separated the trades was how one-sided that delta was: when buys minus sells came to 17% or more of the candle's volume, the trade won 33% of the time, against 49% for the rest.
What is a fair value gap in order flow terms?
A price range that one candle traded through while the candles either side of it never traded there. On a footprint chart the gap's prices only have volume in the middle candle, so you can see exactly how many contracts moved price through it and who was the aggressor.